
- Start >
- Rivers >
- Waterlevel >
- Obere Donau >
- Aha >
- Chart of total period

Chart of total period Aha / Altmühl
Waterlevel from 01.11.1974 to 19.04.2024
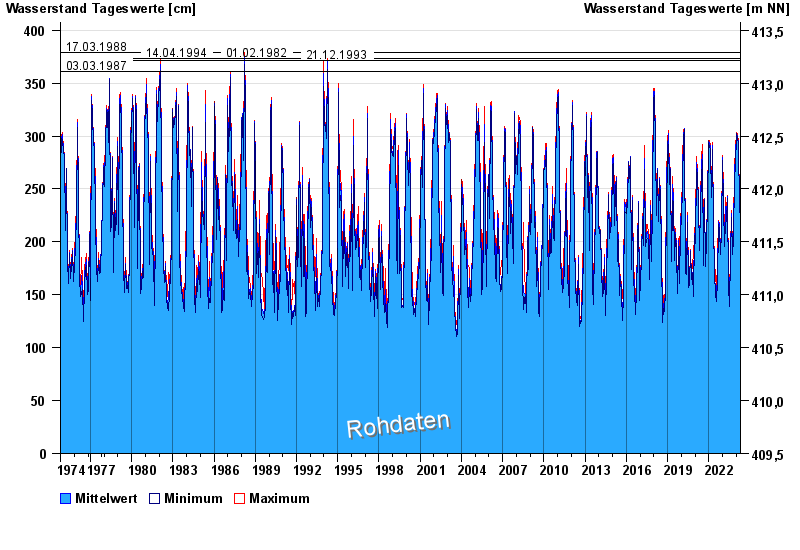
- 17.03.1988 Wasserstand: 379 cm
- 14.04.1994 Wasserstand: 373 cm
- 01.02.1982 Wasserstand: 373 cm
- 21.12.1993 Wasserstand: 371 cm
- 03.03.1987 Wasserstand: 361 cm
| Date | Mean value [cm] | Maximum [cm] | Minimum [cm] |
|---|---|---|---|
| 19.04.2024 | 189 | 194 | 188 |
| 18.04.2024 | 187 | 189 | 185 |
| 17.04.2024 | 182 | 185 | 180 |
| 16.04.2024 | 178 | 180 | 177 |
| 15.04.2024 | 177 | 179 | 174 |
| 14.04.2024 | 175 | 177 | 174 |
| 13.04.2024 | 178 | 180 | 177 |
© Bayerisches Landesamt für Umwelt 2024