
- Start >
- Rivers >
- Waterlevel >
- Isar >
- Unterfinning >
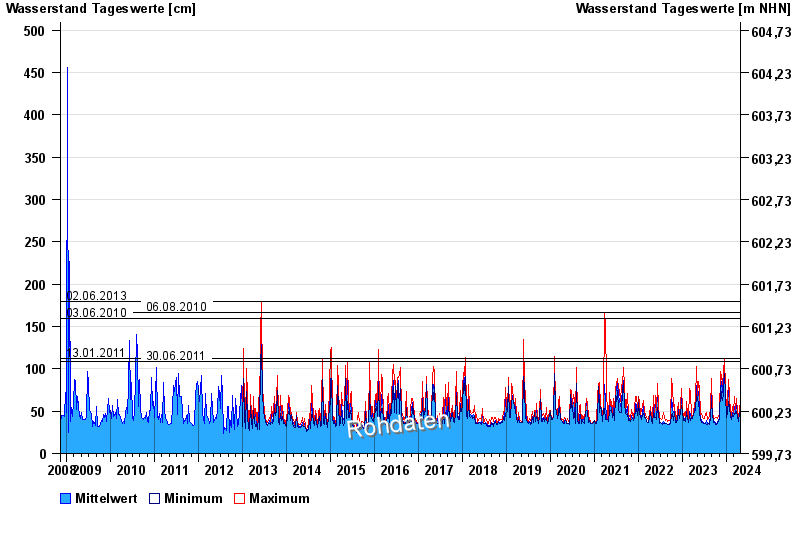
- Chart of total period

Chart of total period Unterfinning / Windach
Waterlevel from 10.11.2008 to 25.04.2024
note
Pegel beeinflusst durch Kraftwerkssteuerung
- 02.06.2013 Wasserstand: 180 cm
- 06.08.2010 Wasserstand: 166 cm
- 03.06.2010 Wasserstand: 159 cm
- 13.01.2011 Wasserstand: 112 cm
- 30.06.2011 Wasserstand: 109 cm
| Date | Mean value [cm] | Maximum [cm] | Minimum [cm] |
|---|---|---|---|
| 25.04.2024 | 43 | 47 | 38 |
| 24.04.2024 | 45 | 47 | 44 |
| 23.04.2024 | 46 | 47 | 46 |
| 22.04.2024 | 53 | 63 | 35 |
| 21.04.2024 | 50 | 51 | 49 |
| 20.04.2024 | 49 | 52 | 47 |
| 19.04.2024 | 47 | 48 | 45 |
© Bayerisches Landesamt für Umwelt 2024