
- Start >
- Rivers >
- Waterlevel >
- Isar >
- Seeshaupt >
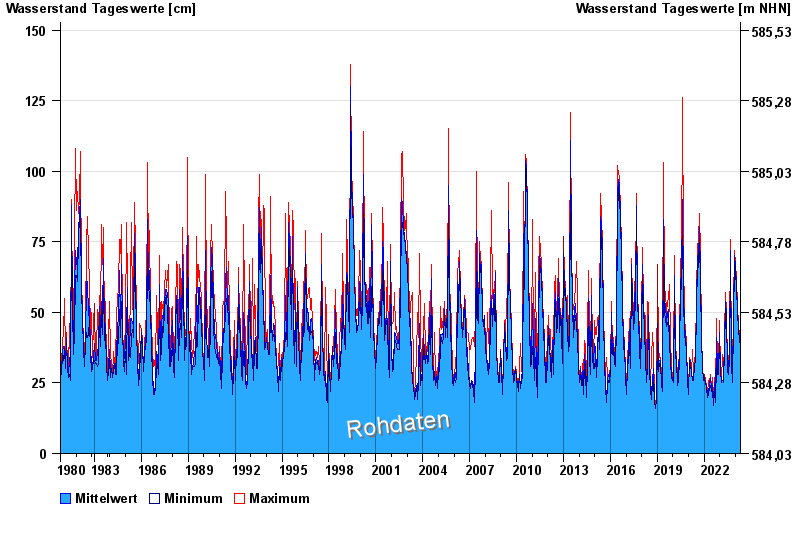
- Chart of total period

Chart of total period Seeshaupt / Steinbach
Waterlevel from 01.11.1980 to 25.04.2024
 Für diesen Pegel sind keine Hochwassermarken hinterlegt.
| Date | Mean value [cm] | Maximum [cm] | Minimum [cm] |
|---|---|---|---|
| 25.04.2024 | 37 | 38 | 37 |
| 24.04.2024 | 38 | 39 | 37 |
| 23.04.2024 | 38 | 40 | 38 |
| 22.04.2024 | 38 | 39 | 37 |
| 21.04.2024 | 37 | 38 | 36 |
| 20.04.2024 | 37 | 37 | 36 |
| 19.04.2024 | 36 | 37 | 34 |
© Bayerisches Landesamt für Umwelt 2024