
- Start >
- Rivers >
- Waterlevel >
- Isar >
- Rottach >
- Chart of total period

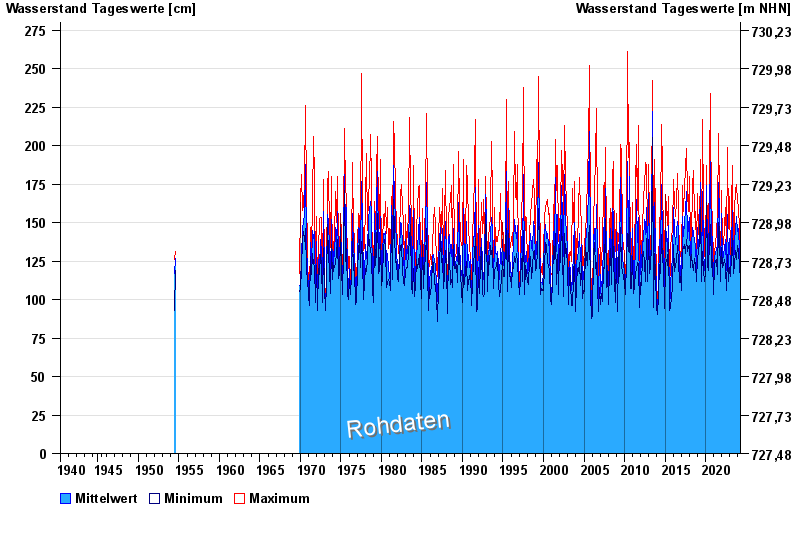
Chart of total period Rottach / Rottach
Waterlevel from 20.05.1940 to 25.04.2024
| Date | Mean value [cm] | Maximum [cm] | Minimum [cm] |
|---|---|---|---|
| 25.04.2024 | 112 | 112 | 111 |
| 24.04.2024 | 112 | 113 | 111 |
| 23.04.2024 | 113 | 114 | 112 |
| 22.04.2024 | 114 | 115 | 113 |
| 21.04.2024 | 114 | 115 | 113 |
| 20.04.2024 | 116 | 119 | 114 |
| 19.04.2024 | 112 | 117 | 111 |
© Bayerisches Landesamt für Umwelt 2024