
- Start >
- Rivers >
- Waterlevel >
- Isar >
- Rottach >
- Chart of total period

Chart of total period Rottach / Rottach
Waterlevel from 20.05.1940 to 18.04.2024
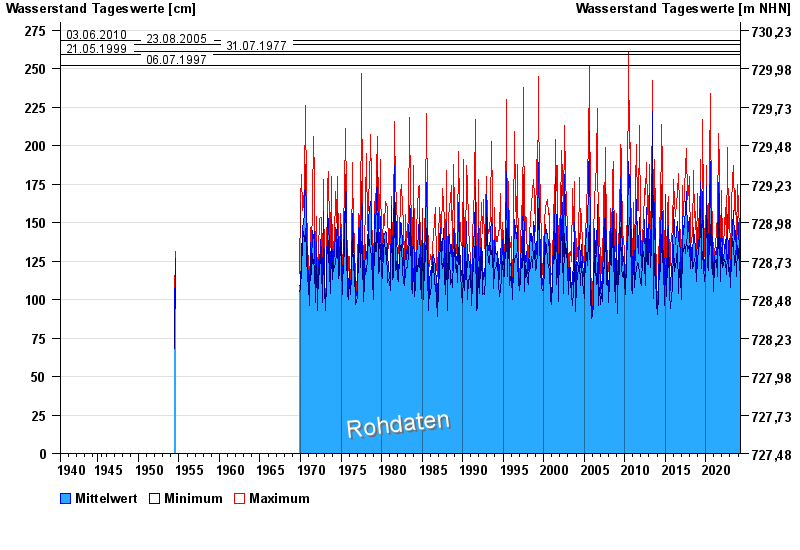
- 03.06.2010 Wasserstand: 268 cm
- 23.08.2005 Wasserstand: 266 cm
- 31.07.1977 Wasserstand: 261 cm
- 21.05.1999 Wasserstand: 259 cm
- 06.07.1997 Wasserstand: 252 cm
| Date | Mean value [cm] | Maximum [cm] | Minimum [cm] |
|---|---|---|---|
| 18.04.2024 | 110 | 112 | 110 |
| 17.04.2024 | 110 | 112 | 109 |
| 16.04.2024 | 111 | 114 | 109 |
| 15.04.2024 | 111 | 114 | 109 |
| 14.04.2024 | 110 | 112 | 109 |
| 13.04.2024 | 111 | 112 | 110 |
| 12.04.2024 | 111 | 114 | 110 |
© Bayerisches Landesamt für Umwelt 2024