
- Start >
- Rivers >
- Waterlevel >
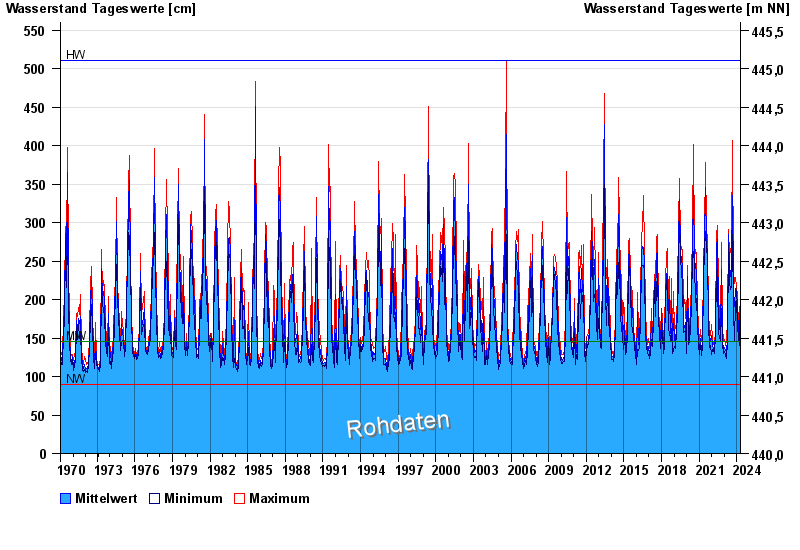
- Isar >
- Rosenheim u.d. Mangfallmündung >
- Chart of total period

Chart of total period Rosenheim u.d. Mangfallmündung / Inn
Waterlevel from 26.01.1970 to 20.04.2024
| Date | Mean value [cm] | Maximum [cm] | Minimum [cm] |
|---|---|---|---|
| 20.04.2024 | 160 | 163 | 153 |
| 19.04.2024 | 159 | 168 | 152 |
| 18.04.2024 | 178 | 185 | 165 |
| 17.04.2024 | 192 | 206 | 180 |
| 16.04.2024 | 206 | 214 | 197 |
| 15.04.2024 | 197 | 211 | 168 |
| 14.04.2024 | 162 | 167 | 155 |
© Bayerisches Landesamt für Umwelt 2024