
- Start >
- Rivers >
- Waterlevel >
- Isar >
- Rosenheim o.d. Mangfallmündung >
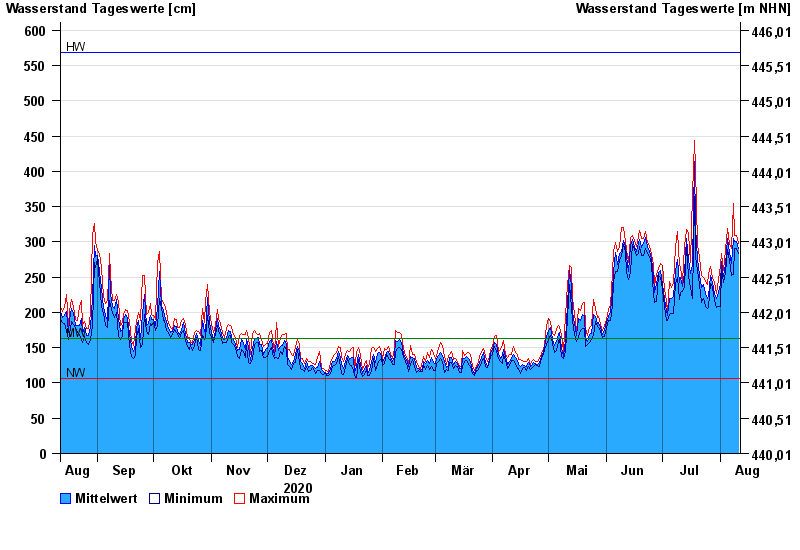
- Chart of year

Chart of year Rosenheim o.d. Mangfallmündung / Inn
Waterlevel from 12.08.2020 to 11.08.2021
| Date | Mean value [cm] | Maximum [cm] | Minimum [cm] |
|---|---|---|---|
| 11.08.2021 | 291 | 297 | 284 |
| 10.08.2021 | 301 | 309 | 291 |
| 09.08.2021 | 300 | 309 | 290 |
| 08.08.2021 | 305 | 355 | 254 |
| 07.08.2021 | 269 | 290 | 253 |
| 06.08.2021 | 285 | 298 | 274 |
| 05.08.2021 | 305 | 319 | 289 |
© Bayerisches Landesamt für Umwelt 2024