
- Start >
- Rivers >
- Waterlevel >
- Isar >
- Rosenheim o.d. Mangfallmündung >
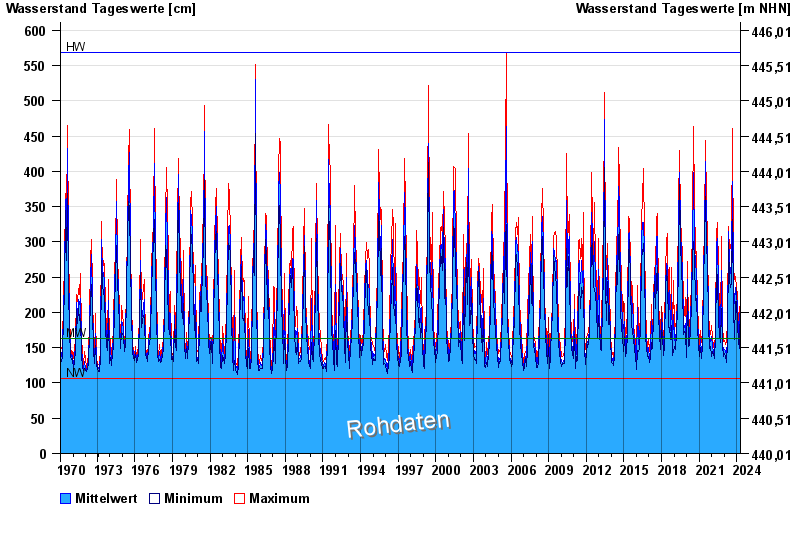
- Chart of total period

Chart of total period Rosenheim o.d. Mangfallmündung / Inn
Waterlevel from 26.01.1970 to 19.04.2024
| Date | Mean value [cm] | Maximum [cm] | Minimum [cm] |
|---|---|---|---|
| 19.04.2024 | 184 | 186 | 178 |
| 18.04.2024 | 197 | 204 | 182 |
| 17.04.2024 | 211 | 226 | 199 |
| 16.04.2024 | 226 | 235 | 217 |
| 15.04.2024 | 217 | 231 | 185 |
| 14.04.2024 | 177 | 184 | 170 |
| 13.04.2024 | 174 | 183 | 167 |
© Bayerisches Landesamt für Umwelt 2024