
- Start >
- Rivers >
- Waterlevel >
- Isar >
- Puppling >
- Chart of year

Chart of year Puppling / Isar
Waterlevel from 01.01.2021 to 31.12.2021
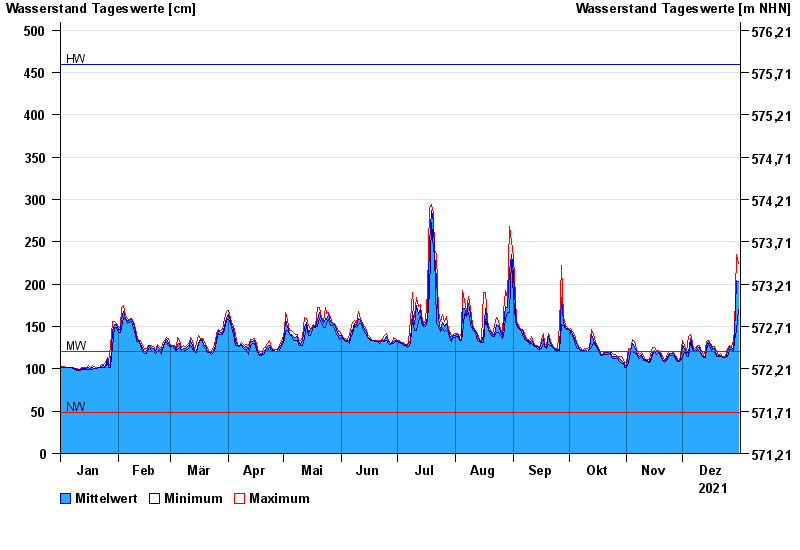
| Date | Mean value [cm] | Maximum [cm] | Minimum [cm] |
|---|---|---|---|
| 31.12.2021 | 203 | 224 | 170 |
| 30.12.2021 | 204 | 235 | 145 |
| 29.12.2021 | 140 | 145 | 134 |
| 28.12.2021 | 123 | 134 | 121 |
| 27.12.2021 | 125 | 126 | 123 |
| 26.12.2021 | 126 | 127 | 123 |
| 25.12.2021 | 120 | 124 | 115 |
© Bayerisches Landesamt für Umwelt 2024