
- Start >
- Rivers >
- Waterlevel >
- Isar >
- Percha >
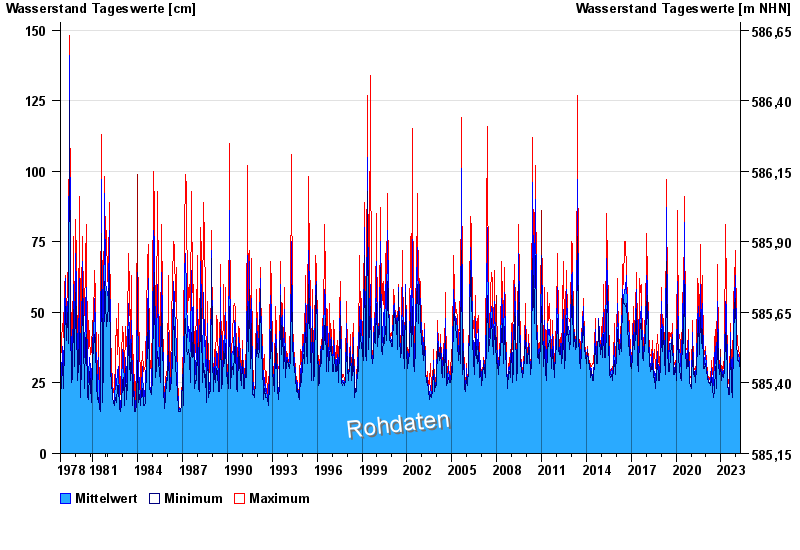
- Chart of total period

Chart of total period Percha / Lüßbach
Waterlevel from 01.11.1978 to 23.04.2024
 Für diesen Pegel sind keine Hochwassermarken hinterlegt.
| Date | Mean value [cm] | Maximum [cm] | Minimum [cm] |
|---|---|---|---|
| 23.04.2024 | 30 | 31 | 29 |
| 22.04.2024 | 31 | 32 | 29 |
| 21.04.2024 | 30 | 32 | 28 |
| 20.04.2024 | 30 | 33 | 29 |
| 19.04.2024 | 29 | 30 | 28 |
| 18.04.2024 | 30 | 33 | 29 |
| 17.04.2024 | 28 | 31 | 27 |
© Bayerisches Landesamt für Umwelt 2024