
- Start >
- Rivers >
- Waterlevel >
- Isar >
- Peißenberg >
- Chart of total period

Chart of total period Peißenberg / Ammer
Waterlevel from 01.11.1963 to 25.04.2024
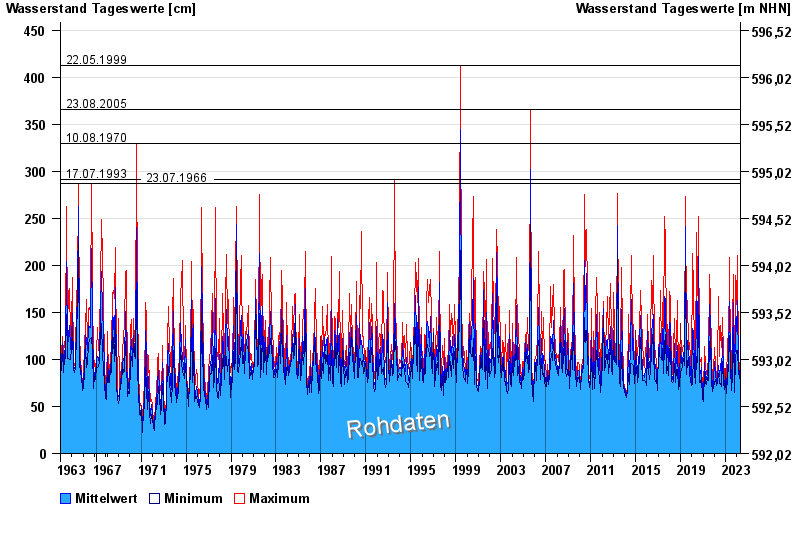
- 22.05.1999 Wasserstand: 412 cm
- 23.08.2005 Wasserstand: 366 cm
- 10.08.1970 Wasserstand: 330 cm
- 17.07.1993 Wasserstand: 291 cm
- 23.07.1966 Wasserstand: 287 cm
| Date | Mean value [cm] | Maximum [cm] | Minimum [cm] |
|---|---|---|---|
| 25.04.2024 | 78 | 81 | 77 |
| 24.04.2024 | 76 | 80 | 75 |
| 23.04.2024 | 76 | 77 | 75 |
| 22.04.2024 | 76 | 78 | 75 |
| 21.04.2024 | 77 | 78 | 76 |
| 20.04.2024 | 78 | 79 | 75 |
| 19.04.2024 | 76 | 78 | 74 |
© Bayerisches Landesamt für Umwelt 2024