
- Start >
- Rivers >
- Waterlevel >
- Isar >
- Obernach >
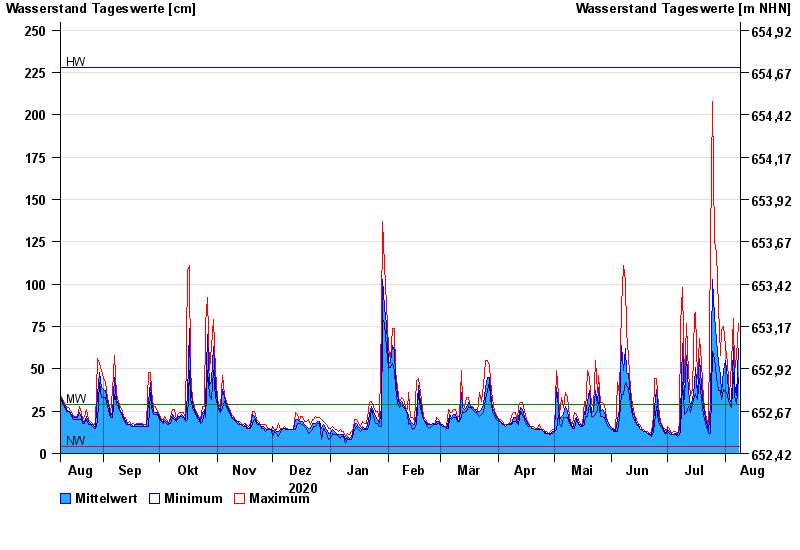
- Chart of year

Chart of year Obernach / Ach
Waterlevel from 09.08.2020 to 08.08.2021
| Date | Mean value [cm] | Maximum [cm] | Minimum [cm] |
|---|---|---|---|
| 08.08.2021 | 62 | 77 | 45 |
| 07.08.2021 | 34 | 57 | 29 |
| 06.08.2021 | 41 | 48 | 34 |
| 05.08.2021 | 63 | 80 | 48 |
| 04.08.2021 | 30 | 54 | 27 |
| 03.08.2021 | 32 | 34 | 29 |
| 02.08.2021 | 44 | 53 | 34 |
© Bayerisches Landesamt für Umwelt 2024