
- Start >
- Rivers >
- Waterlevel >
- Isar >
- Oberhausen >
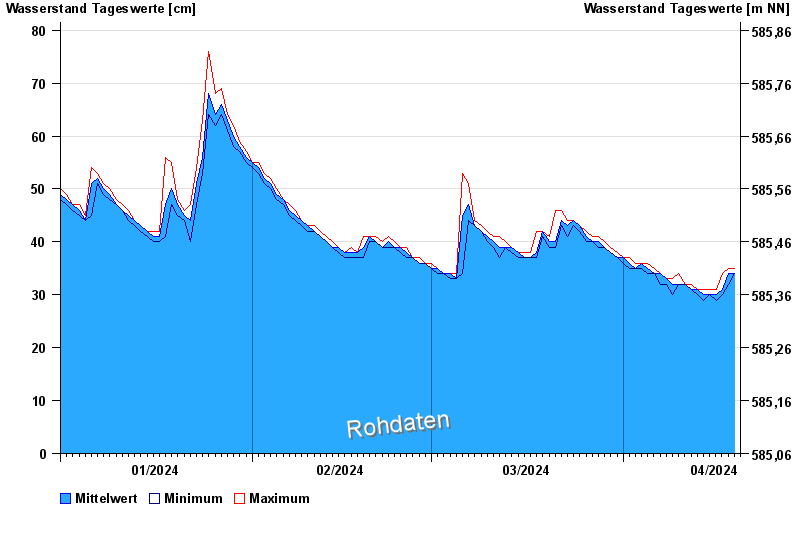
- Chart of year

Chart of year Oberhausen / Ach
Waterlevel from 01.01.2024 to 19.04.2024
- 09.06.2016 Wasserstand: 219 cm
- 31.07.1977 Wasserstand: 218 cm
- 21.05.1999 Wasserstand: 201 cm
- 23.08.2005 Wasserstand: 199 cm
- 25.05.1971 Wasserstand: 193 cm
| Date | Mean value [cm] | Maximum [cm] | Minimum [cm] |
|---|---|---|---|
| 19.04.2024 | 35 | 35 | 34 |
| 18.04.2024 | 34 | 35 | 32 |
| 17.04.2024 | 31 | 34 | 30 |
| 16.04.2024 | 30 | 31 | 29 |
| 15.04.2024 | 30 | 31 | 30 |
| 14.04.2024 | 30 | 31 | 29 |
| 13.04.2024 | 31 | 31 | 30 |
© Bayerisches Landesamt für Umwelt 2024