
- Start >
- Rivers >
- Waterlevel >
- Isar >
- Neumühlschwaig >
- Chart of total period

Chart of total period Neumühlschwaig / Amper
Waterlevel from 02.03.2004 to 23.04.2024
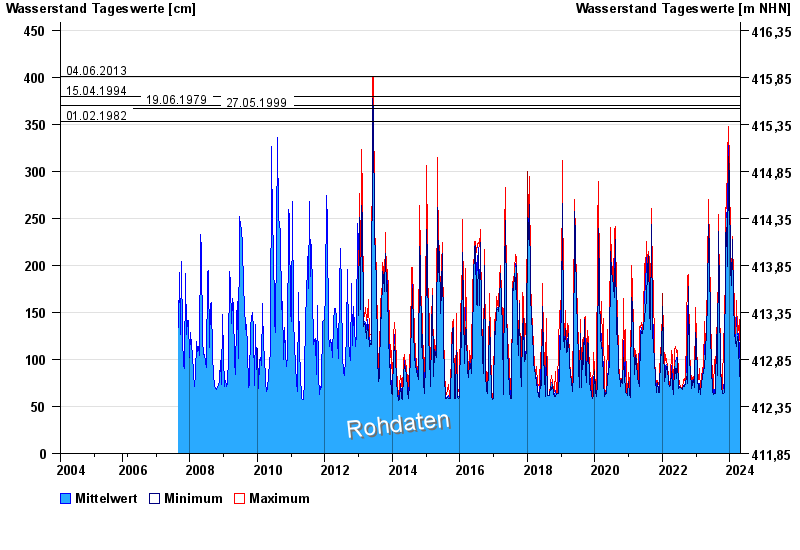
- 04.06.2013 Wasserstand: 401 cm
- 15.04.1994 Wasserstand: 379 cm
- 19.06.1979 Wasserstand: 370 cm
- 27.05.1999 Wasserstand: 367 cm
- 01.02.1982 Wasserstand: 353 cm
| Date | Mean value [cm] | Maximum [cm] | Minimum [cm] |
|---|---|---|---|
| 23.04.2024 | 94 | 96 | 92 |
| 22.04.2024 | 93 | 96 | 88 |
| 21.04.2024 | 89 | 90 | 86 |
| 20.04.2024 | 88 | 91 | 84 |
| 19.04.2024 | 85 | 86 | 83 |
| 18.04.2024 | 84 | 86 | 82 |
| 17.04.2024 | 81 | 86 | 77 |
© Bayerisches Landesamt für Umwelt 2024