
- Start >
- Rivers >
- Waterlevel >
- Isar >
- München >
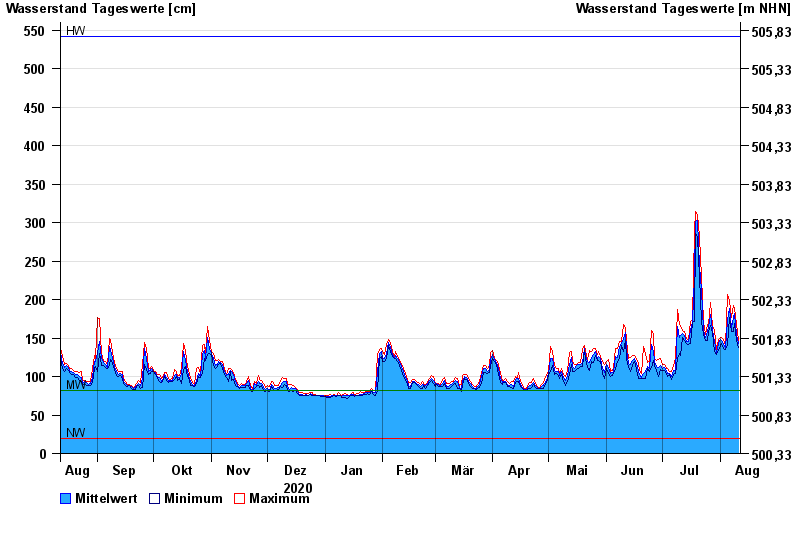
- Chart of year

Chart of year München / Isar
Waterlevel from 12.08.2020 to 11.08.2021
| Date | Mean value [cm] | Maximum [cm] | Minimum [cm] |
|---|---|---|---|
| 11.08.2021 | 143 | 147 | 138 |
| 10.08.2021 | 155 | 169 | 147 |
| 09.08.2021 | 182 | 189 | 169 |
| 08.08.2021 | 177 | 192 | 159 |
| 07.08.2021 | 164 | 177 | 158 |
| 06.08.2021 | 189 | 199 | 177 |
| 05.08.2021 | 174 | 206 | 140 |
© Bayerisches Landesamt für Umwelt 2024