
- Start >
- Rivers >
- Waterlevel >
- Isar >
- Mühltal >
- Chart of year

Chart of year Mühltal / Glonn
Waterlevel from 24.08.2020 to 23.08.2021
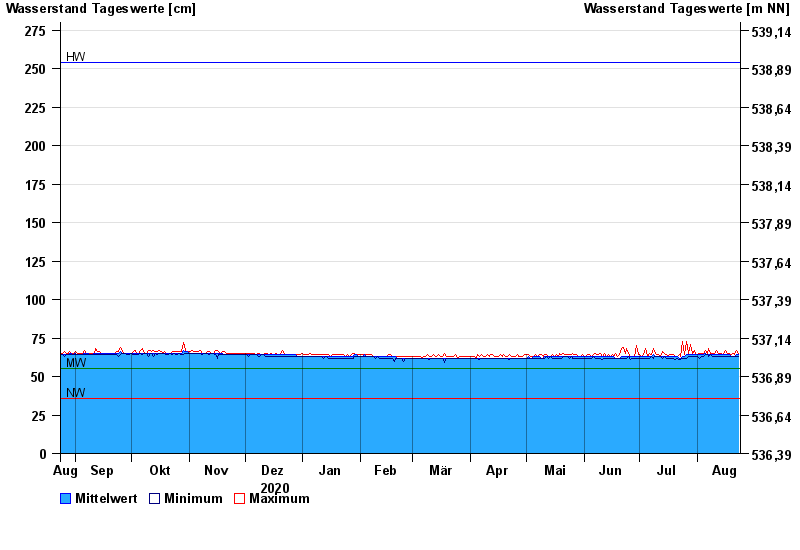
| Date | Mean value [cm] | Maximum [cm] | Minimum [cm] |
|---|---|---|---|
| 23.08.2021 | 64 | 64 | 63 |
| 22.08.2021 | 64 | 67 | 63 |
| 21.08.2021 | 63 | 64 | 63 |
| 20.08.2021 | 63 | 65 | 63 |
| 19.08.2021 | 63 | 64 | 63 |
| 18.08.2021 | 64 | 65 | 63 |
| 17.08.2021 | 64 | 65 | 63 |
© Bayerisches Landesamt für Umwelt 2024