
- Start >
- Rivers >
- Waterlevel >
- Isar >
- Mering >
- Chart of year

Chart of year Mering / Paar
Waterlevel from 07.06.2020 to 06.06.2021
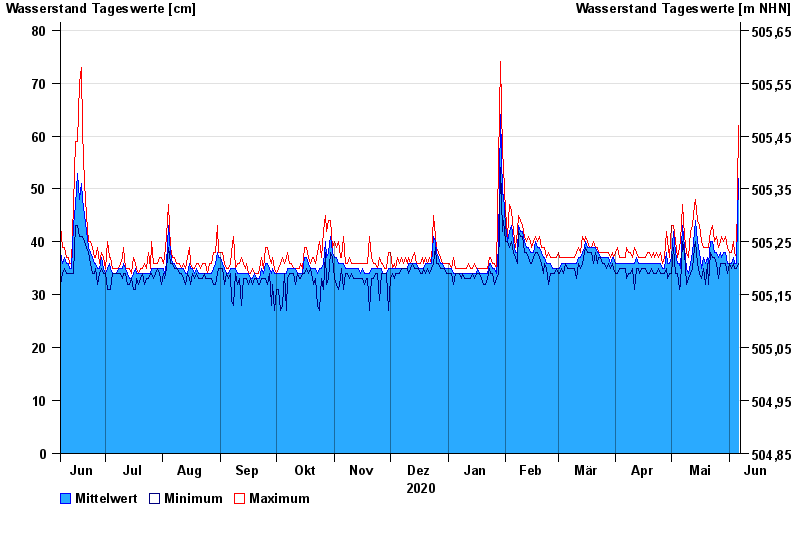
| Date | Mean value [cm] | Maximum [cm] | Minimum [cm] |
|---|---|---|---|
| 06.06.2021 | 52 | 62 | 36 |
| 05.06.2021 | 36 | 37 | 35 |
| 04.06.2021 | 36 | 38 | 35 |
| 03.06.2021 | 37 | 40 | 36 |
| 02.06.2021 | 36 | 38 | 35 |
| 01.06.2021 | 36 | 38 | 36 |
| 31.05.2021 | 36 | 39 | 34 |
© Bayerisches Landesamt für Umwelt 2024