
- Start >
- Rivers >
- Waterlevel >
- Isar >
- Landshut Flutmulde >
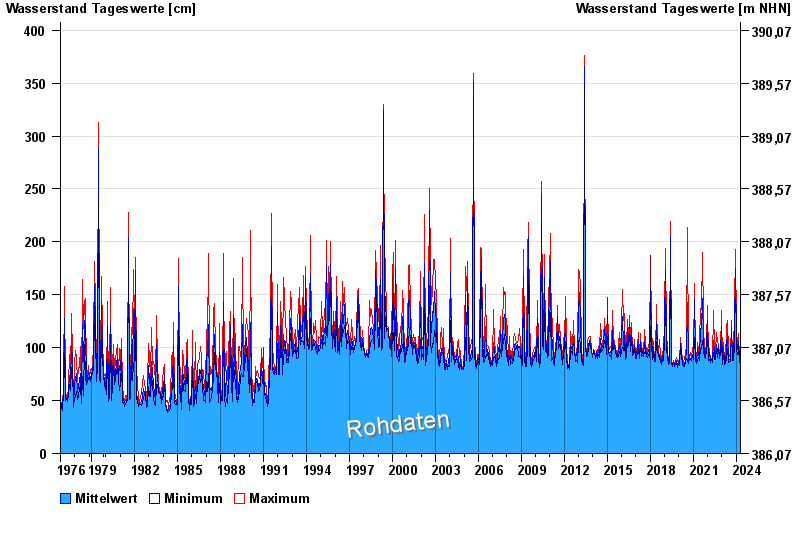
- Chart of total period

Chart of total period Landshut Flutmulde / Isar
Waterlevel from 01.11.1976 to 19.04.2024
| Date | Mean value [cm] | Maximum [cm] | Minimum [cm] |
|---|---|---|---|
| 19.04.2024 | 84 | 85 | 84 |
| 18.04.2024 | 85 | 86 | 84 |
| 17.04.2024 | 85 | 86 | 84 |
| 16.04.2024 | 85 | 87 | 84 |
| 15.04.2024 | 84 | 87 | 82 |
| 14.04.2024 | 83 | 83 | 82 |
| 13.04.2024 | 83 | 83 | 82 |
© Bayerisches Landesamt für Umwelt 2024