
- Start >
- Rivers >
- Waterlevel >
- Isar >
- Landsberg >
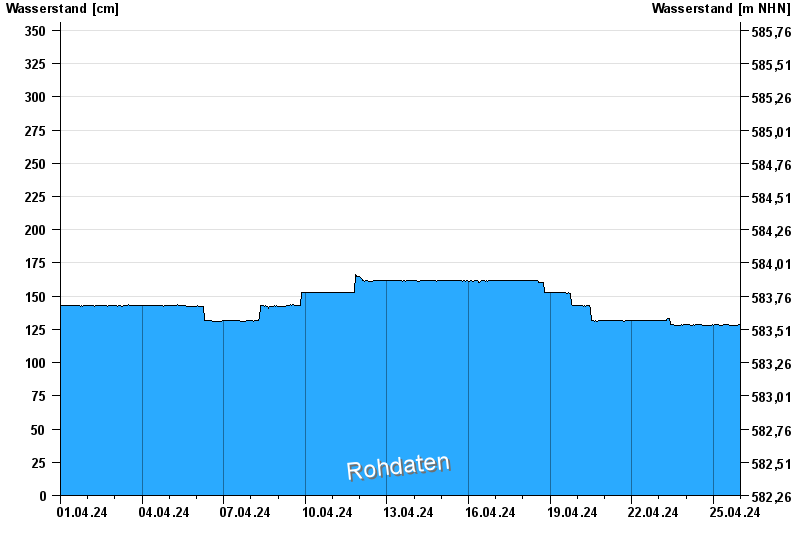
- Chart of month

Chart of month Landsberg / Lech
Waterlevel from 01.04.2024 to 25.04.2024
note
Messwerte beeinflusst durch Kraftwerkssteuerungen.
- 10.08.1970 Wasserstand: 478 cm
- 22.05.1999 Wasserstand: 437 cm
- 23.08.2005 Wasserstand: 414 cm
- 24.07.1966 Wasserstand: 408 cm
- 11.06.1965 Wasserstand: 390 cm
| Date | Waterlevel [cm] |
|---|---|
| 25.04.2024 09:00 | 129 |
| 25.04.2024 08:45 | 128 |
| 25.04.2024 08:30 | 128 |
| 25.04.2024 08:15 | 128 |
| 25.04.2024 08:00 | 128 |
| 25.04.2024 07:45 | 128 |
| 25.04.2024 07:30 | 128 |
© Bayerisches Landesamt für Umwelt 2024