
- Start >
- Rivers >
- Waterlevel >
- Isar >
- Großschwindau >
- Chart of total period

Chart of total period Großschwindau / Goldach
Waterlevel from 01.11.1969 to 19.04.2024
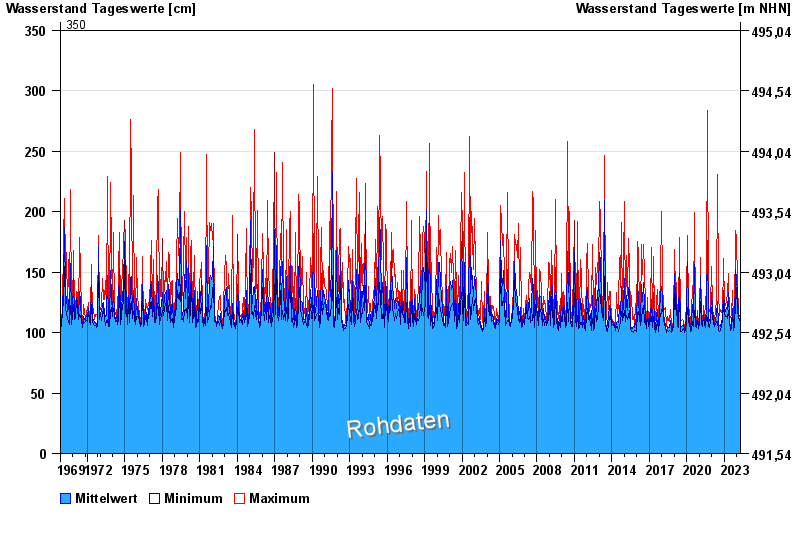
- 350 cm: Großschwindau: zu erwartender Pegelstand bei hundertjährlichem Hochwasser
| Date | Mean value [cm] | Maximum [cm] | Minimum [cm] |
|---|---|---|---|
| 19.04.2024 | 109 | 109 | 108 |
| 18.04.2024 | 110 | 112 | 108 |
| 17.04.2024 | 110 | 112 | 104 |
| 16.04.2024 | 105 | 106 | 104 |
| 15.04.2024 | 106 | 111 | 104 |
| 14.04.2024 | 104 | 105 | 104 |
| 13.04.2024 | 104 | 105 | 104 |
© Bayerisches Landesamt für Umwelt 2024