
- Start >
- Rivers >
- Waterlevel >
- Isar >
- Garmisch u. d. Partnachmündung >
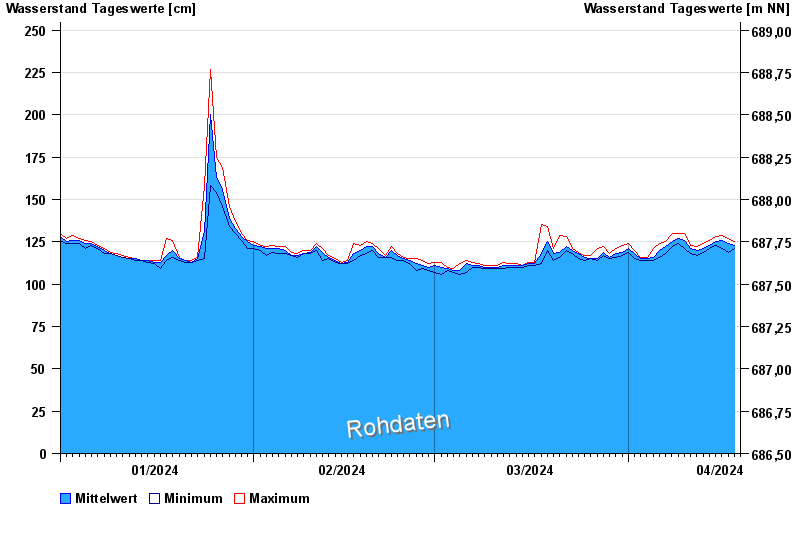
- Chart of year

Chart of year Garmisch u. d. Partnachmündung / Loisach
Waterlevel from 01.01.2024 to 18.04.2024
note
Messwerte beeinflusst durch Kraftwerkssteuerungen.
- 22.05.1999 Wasserstand: 410 cm
- 31.05.1940 Wasserstand: 408 cm
- 23.08.1937 Wasserstand: 408 cm
- 23.08.2005 Wasserstand: 374 cm
- 11.06.1965 Wasserstand: 362 cm
| Date | Mean value [cm] | Maximum [cm] | Minimum [cm] |
|---|---|---|---|
| 18.04.2024 | 123 | 125 | 122 |
| 17.04.2024 | 124 | 127 | 119 |
| 16.04.2024 | 126 | 129 | 121 |
| 15.04.2024 | 125 | 128 | 123 |
| 14.04.2024 | 123 | 126 | 121 |
| 13.04.2024 | 121 | 124 | 119 |
| 12.04.2024 | 120 | 122 | 117 |
© Bayerisches Landesamt für Umwelt 2024