
- Start >
- Rivers >
- Waterlevel >
- Isar >
- Gaißach >
- Chart of year

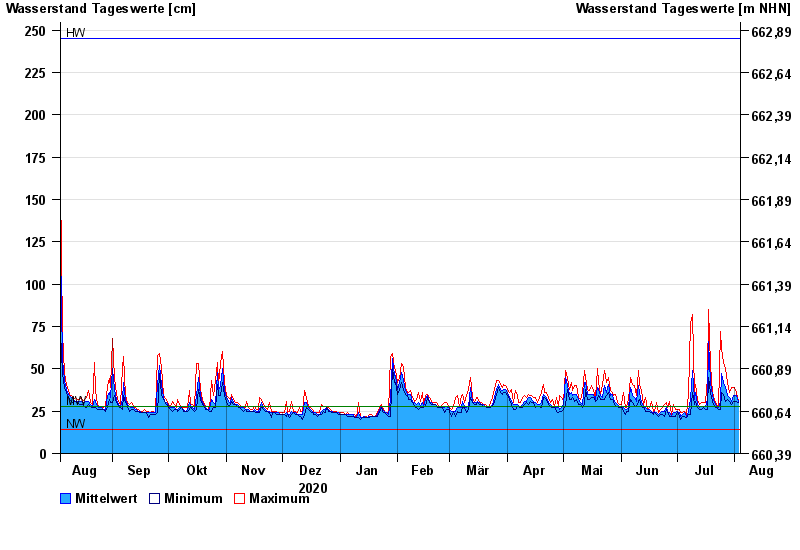
Chart of year Gaißach / Große Gaißach
Waterlevel from 04.08.2020 to 03.08.2021
| Date | Mean value [cm] | Maximum [cm] | Minimum [cm] |
|---|---|---|---|
| 03.08.2021 | 31 | 31 | 30 |
| 02.08.2021 | 34 | 36 | 31 |
| 01.08.2021 | 34 | 39 | 31 |
| 31.07.2021 | 34 | 39 | 31 |
| 30.07.2021 | 31 | 39 | 29 |
| 29.07.2021 | 33 | 36 | 31 |
| 28.07.2021 | 34 | 42 | 32 |
© Bayerisches Landesamt für Umwelt 2024