
- Start >
- Rivers >
- Waterlevel >
- Isar >
- Gaden >
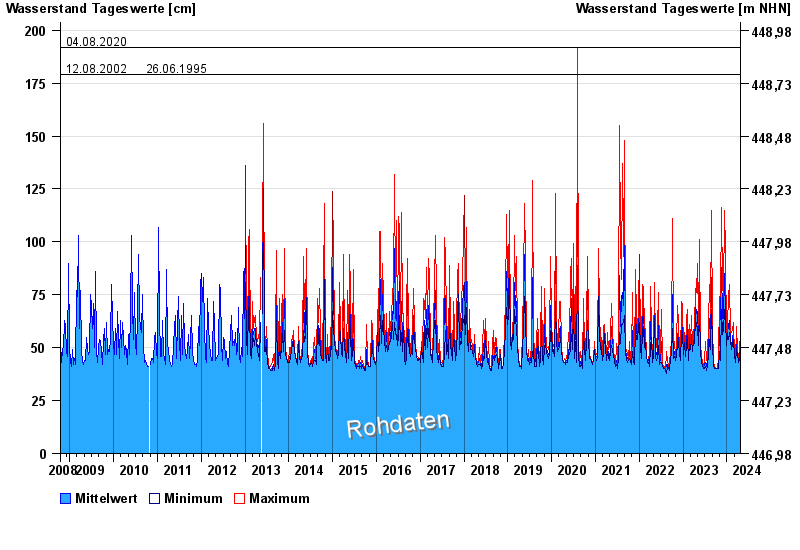
- Chart of total period

Chart of total period Gaden / Schinderbach
Waterlevel from 15.10.2008 to 23.04.2024
note
Datenabruf nur 07:00, 15:00 und 23:00 MEZ
- 07.07.1983 Wasserstand: 214 cm
- 22.06.2006 Wasserstand: 208 cm
- 04.08.2020 Wasserstand: 192 cm
- 12.08.2002 Wasserstand: 179 cm
- 26.06.1995 Wasserstand: 179 cm
| Date | Mean value [cm] | Maximum [cm] | Minimum [cm] |
|---|---|---|---|
| 23.04.2024 | 50 | 50 | 49 |
| 22.04.2024 | 53 | 54 | 50 |
| 21.04.2024 | 53 | 55 | 52 |
| 20.04.2024 | 52 | 54 | 50 |
| 19.04.2024 | 45 | 51 | 44 |
| 18.04.2024 | 45 | 45 | 44 |
| 17.04.2024 | 43 | 45 | 41 |
© Bayerisches Landesamt für Umwelt 2024