
- Start >
- Rivers >
- Waterlevel >
- Isar >
- Fürstenfeldbruck >
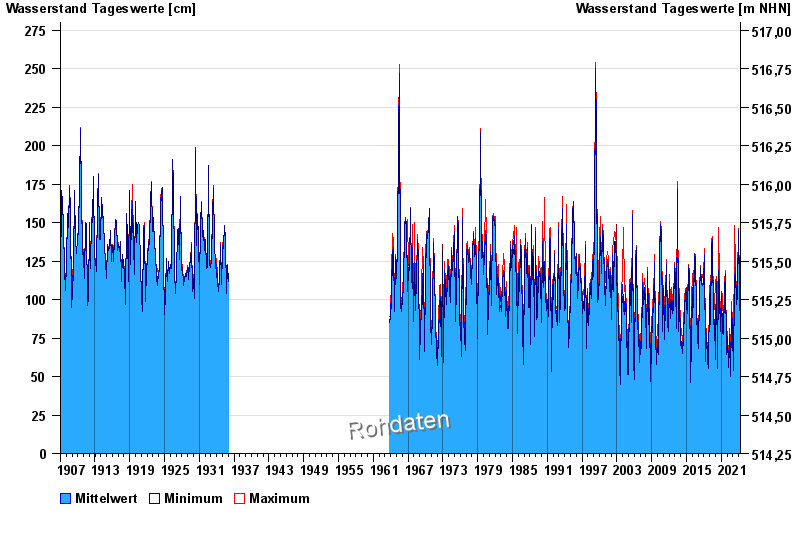
- Chart of total period

Chart of total period Fürstenfeldbruck / Amper
Waterlevel from 01.02.1907 to 24.04.2024
| Date | Mean value [cm] | Maximum [cm] | Minimum [cm] |
|---|---|---|---|
| 24.04.2024 | 62 | 63 | 61 |
| 23.04.2024 | 61 | 64 | 60 |
| 22.04.2024 | 63 | 65 | 61 |
| 21.04.2024 | 59 | 62 | 57 |
| 20.04.2024 | 57 | 59 | 56 |
| 19.04.2024 | 55 | 57 | 53 |
| 18.04.2024 | 51 | 54 | 49 |
© Bayerisches Landesamt für Umwelt 2024