
- Start >
- Rivers >
- Waterlevel >
- Isar >
- Fürstenfeldbruck >
- Chart of total period

Chart of total period Fürstenfeldbruck / Amper
Waterlevel from 01.02.1907 to 20.04.2024
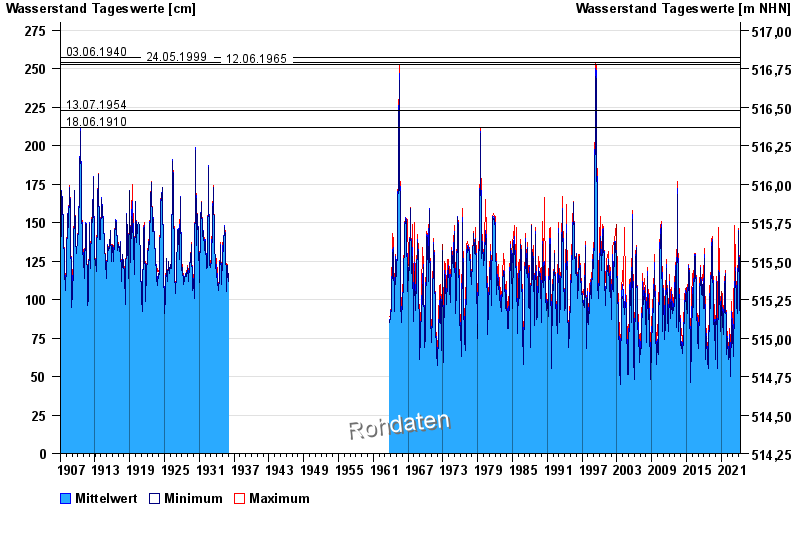
- 03.06.1940 Wasserstand: 257 cm
- 24.05.1999 Wasserstand: 254 cm
- 12.06.1965 Wasserstand: 253 cm
- 13.07.1954 Wasserstand: 223 cm
- 18.06.1910 Wasserstand: 212 cm
| Date | Mean value [cm] | Maximum [cm] | Minimum [cm] |
|---|---|---|---|
| 20.04.2024 | 57 | 58 | 56 |
| 19.04.2024 | 55 | 57 | 53 |
| 18.04.2024 | 51 | 54 | 49 |
| 17.04.2024 | 49 | 54 | 38 |
| 16.04.2024 | 50 | 55 | 48 |
| 15.04.2024 | 47 | 52 | 40 |
| 14.04.2024 | 46 | 48 | 45 |
© Bayerisches Landesamt für Umwelt 2024