
- Start >
- Rivers >
- Waterlevel >
- Isar >
- Freising >
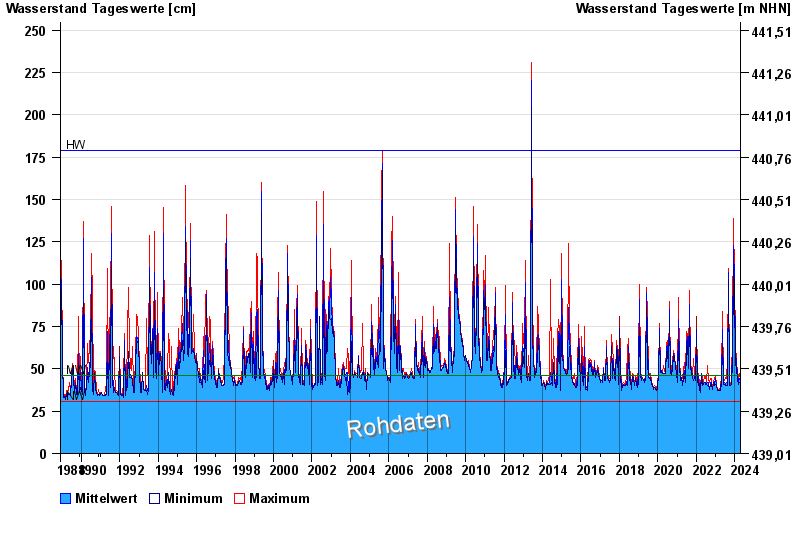
- Chart of total period

Chart of total period Freising / Schleifermoosach
Waterlevel from 30.11.1988 to 19.04.2024
| Date | Mean value [cm] | Maximum [cm] | Minimum [cm] |
|---|---|---|---|
| 19.04.2024 | 42 | 42 | 42 |
| 18.04.2024 | 42 | 43 | 42 |
| 17.04.2024 | 43 | 45 | 41 |
| 16.04.2024 | 41 | 42 | 41 |
| 15.04.2024 | 42 | 43 | 41 |
| 14.04.2024 | 42 | 42 | 41 |
| 13.04.2024 | 42 | 42 | 41 |
© Bayerisches Landesamt für Umwelt 2024