
- Start >
- Rivers >
- Waterlevel >
- Isar >
- Feldolling >
- Chart of total period

Chart of total period Feldolling / Mangfall
Waterlevel from 20.05.1940 to 19.04.2024
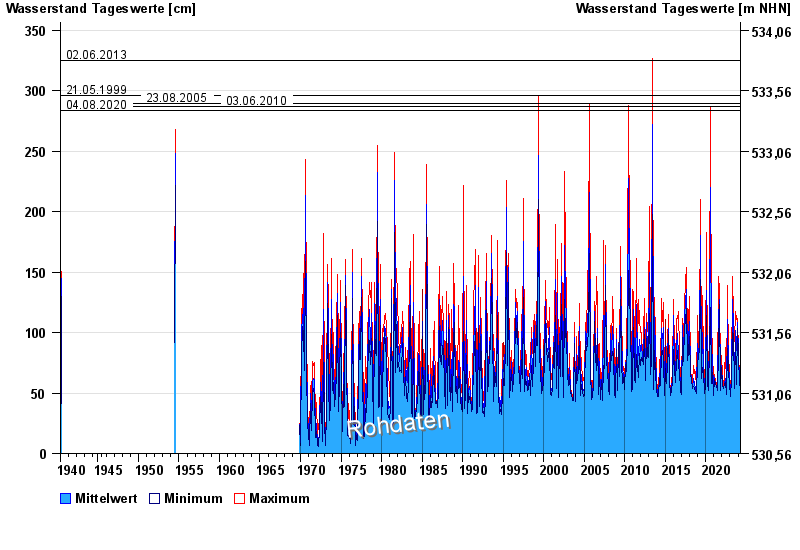
- 02.06.2013 Wasserstand: 325 cm
- 21.05.1999 Wasserstand: 296 cm
- 23.08.2005 Wasserstand: 289 cm
- 03.06.2010 Wasserstand: 287 cm
- 04.08.2020 Wasserstand: 284 cm
| Date | Mean value [cm] | Maximum [cm] | Minimum [cm] |
|---|---|---|---|
| 19.04.2024 | 49 | 49 | 48 |
| 18.04.2024 | 49 | 49 | 48 |
| 17.04.2024 | 48 | 49 | 48 |
| 16.04.2024 | 49 | 49 | 48 |
| 15.04.2024 | 50 | 53 | 49 |
| 14.04.2024 | 58 | 59 | 53 |
| 13.04.2024 | 53 | 58 | 49 |
© Bayerisches Landesamt für Umwelt 2024