
- Start >
- Rivers >
- Waterlevel >
- Isar >
- Eschenlohe Brücke >
- Chart of total period

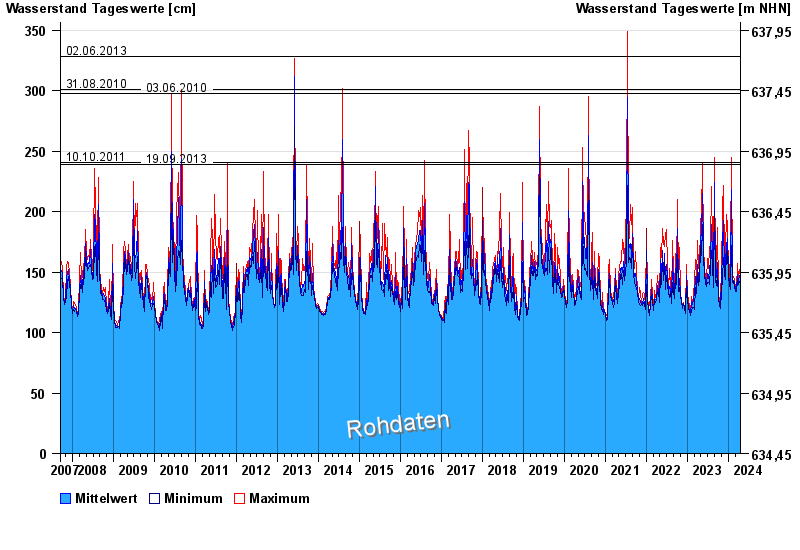
Chart of total period Eschenlohe Brücke / Loisach
Waterlevel from 15.09.2007 to 17.04.2024
note
Messwerte beeinflusst durch Kraftwerkssteuerungen.
- 02.06.2013 Wasserstand: 328 cm
- 31.08.2010 Wasserstand: 301 cm
- 03.06.2010 Wasserstand: 298 cm
- 10.10.2011 Wasserstand: 241 cm
- 19.09.2013 Wasserstand: 239 cm
| Date | Mean value [cm] | Maximum [cm] | Minimum [cm] |
|---|---|---|---|
| 17.04.2024 | 142 | 143 | 141 |
| 16.04.2024 | 145 | 148 | 142 |
| 15.04.2024 | 144 | 148 | 142 |
| 14.04.2024 | 142 | 145 | 140 |
| 13.04.2024 | 141 | 144 | 139 |
| 12.04.2024 | 140 | 142 | 138 |
| 11.04.2024 | 140 | 142 | 138 |
© Bayerisches Landesamt für Umwelt 2024