
- Start >
- Rivers >
- Waterlevel >
- Isar >
- Erb >
- Chart of total period

Chart of total period Erb / Leitzach
Waterlevel from 27.05.1940 to 18.04.2024
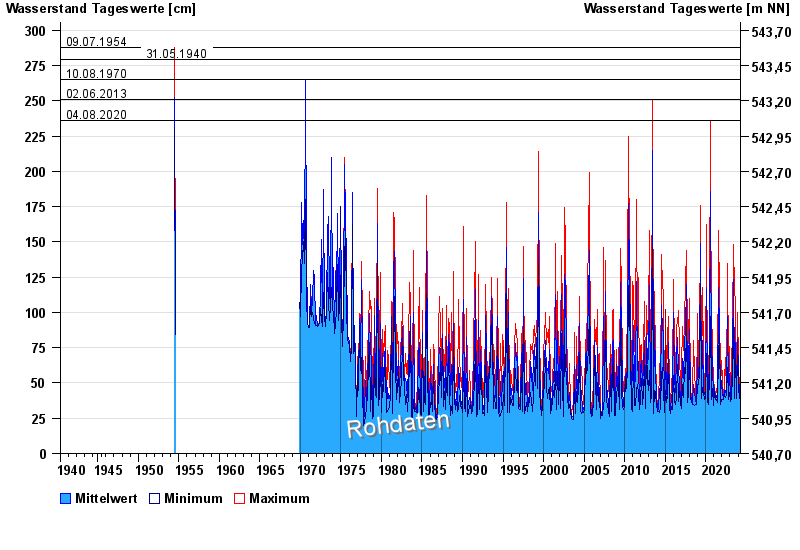
- 09.07.1954 Wasserstand: 288 cm
- 31.05.1940 Wasserstand: 279 cm
- 10.08.1970 Wasserstand: 265 cm
- 02.06.2013 Wasserstand: 251 cm
- 04.08.2020 Wasserstand: 236 cm
| Date | Mean value [cm] | Maximum [cm] | Minimum [cm] |
|---|---|---|---|
| 18.04.2024 | 36 | 36 | 36 |
| 17.04.2024 | 36 | 36 | 35 |
| 16.04.2024 | 36 | 36 | 35 |
| 15.04.2024 | 36 | 36 | 35 |
| 14.04.2024 | 44 | 45 | 36 |
| 13.04.2024 | 40 | 45 | 35 |
| 12.04.2024 | 35 | 36 | 35 |
© Bayerisches Landesamt für Umwelt 2024