
- Start >
- Rivers >
- Waterlevel >
- Isar >
- Eching >
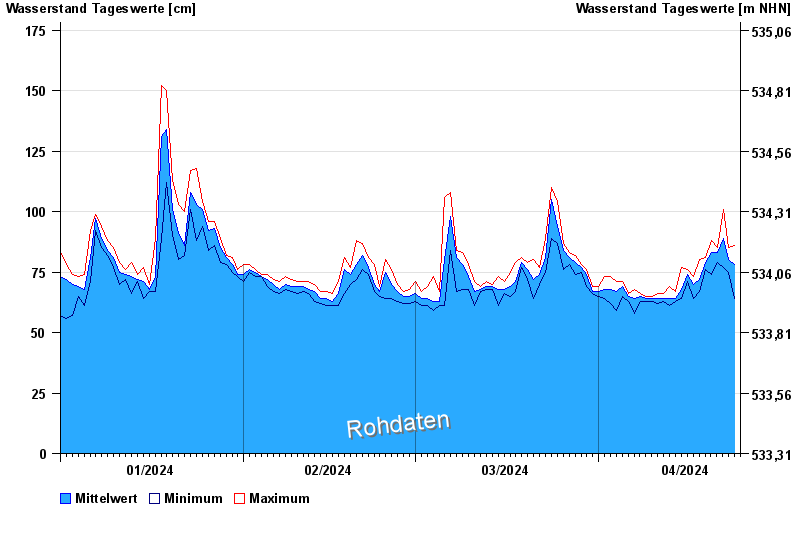
- Chart of year

Chart of year Eching / Windach
Waterlevel from 01.01.2024 to 24.04.2024
note
Pegel beeinflusst durch Kraftwerkssteuerung
- 02.06.2013 Wasserstand: 264 cm
- 22.05.2019 Wasserstand: 216 cm
- 04.01.2015 Wasserstand: 207 cm
- 20.07.2011 Wasserstand: 200 cm
- 06.01.2013 Wasserstand: 196 cm
| Date | Mean value [cm] | Maximum [cm] | Minimum [cm] |
|---|---|---|---|
| 24.04.2024 | 78 | 86 | 64 |
| 23.04.2024 | 80 | 85 | 75 |
| 22.04.2024 | 89 | 101 | 77 |
| 21.04.2024 | 83 | 85 | 79 |
| 20.04.2024 | 83 | 88 | 74 |
| 19.04.2024 | 79 | 81 | 76 |
| 18.04.2024 | 72 | 80 | 67 |
© Bayerisches Landesamt für Umwelt 2024