
- Start >
- Rivers >
- Waterlevel >
- Isar >
- Eching >
- Chart of total period

Chart of total period Eching / Windach
Waterlevel from 19.01.2011 to 18.04.2024
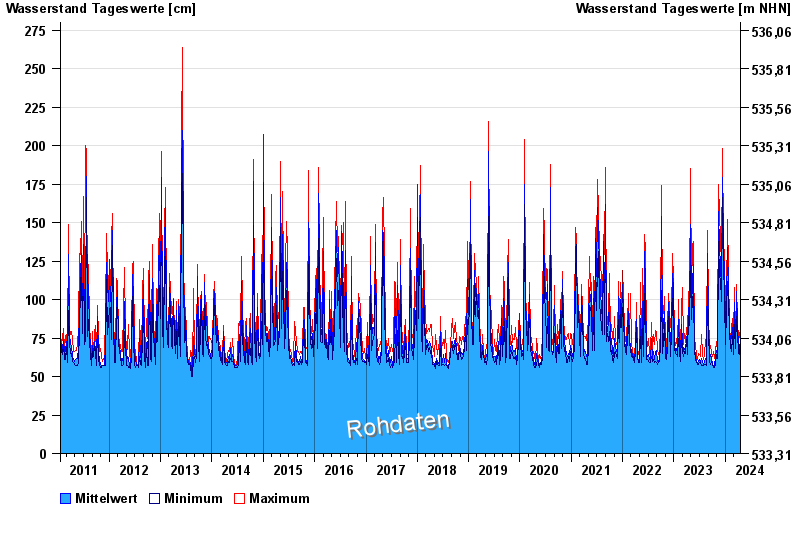
note
Pegel beeinflusst durch Kraftwerkssteuerung
| Date | Mean value [cm] | Maximum [cm] | Minimum [cm] |
|---|---|---|---|
| 18.04.2024 | 69 | 76 | 67 |
| 17.04.2024 | 70 | 73 | 64 |
| 16.04.2024 | 74 | 76 | 71 |
| 15.04.2024 | 68 | 77 | 64 |
| 14.04.2024 | 64 | 67 | 63 |
| 13.04.2024 | 64 | 69 | 61 |
| 12.04.2024 | 64 | 66 | 63 |
© Bayerisches Landesamt für Umwelt 2024