
- Start >
- Rivers >
- Waterlevel >
- Isar >
- Bad Tölz >
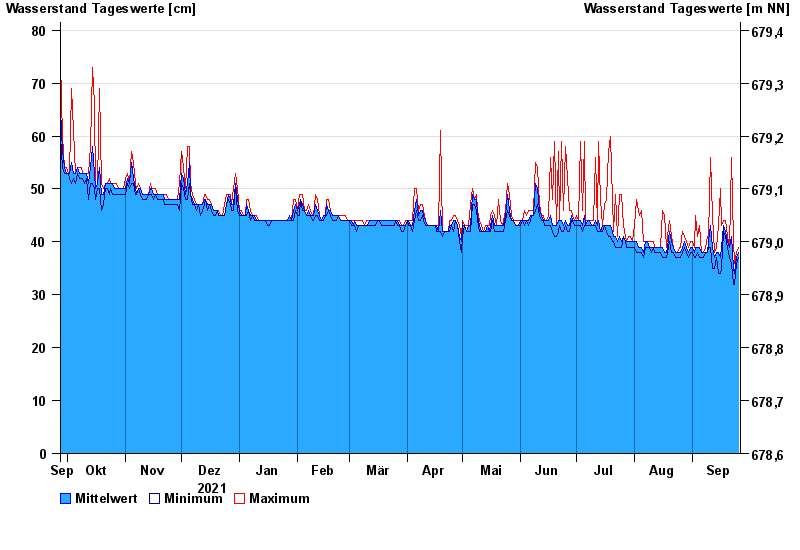
- Chart of year

Chart of year Bad Tölz / Ellbach
Waterlevel from 27.09.2021 to 26.09.2022
- 21.05.1999 Wasserstand: 123 cm
- 23.07.1966 Wasserstand: 116 cm
- 10.09.2010 Wasserstand: 112 cm
- 18.06.1979 Wasserstand: 107 cm
- 02.06.2013 Wasserstand: 106 cm
| Date | Mean value [cm] | Maximum [cm] | Minimum [cm] |
|---|---|---|---|
| 26.09.2022 | 38 | 39 | 37 |
| 25.09.2022 | 37 | 38 | 36 |
| 24.09.2022 | 34 | 36 | 32 |
| 23.09.2022 | 35 | 40 | 32 |
| 22.09.2022 | 41 | 56 | 36 |
| 21.09.2022 | 39 | 39 | 37 |
| 20.09.2022 | 40 | 41 | 39 |
© Bayerisches Landesamt für Umwelt 2024