
- Start >
- Rivers >
- Waterlevel >
- Isar >
- Bad Tölz >
- Chart of month

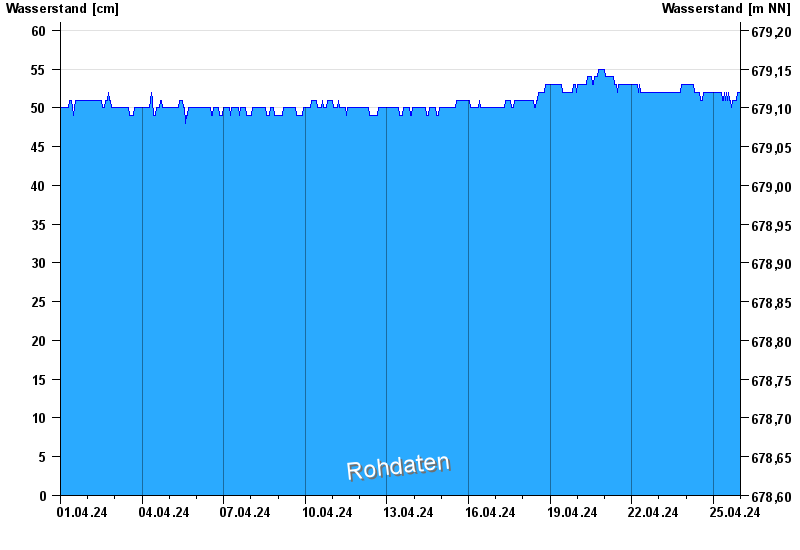
Chart of month Bad Tölz / Ellbach
Waterlevel from 01.04.2024 to 25.04.2024
 Für diesen Pegel sind keine Meldestufen hinterlegt.
| Date | Waterlevel [cm] |
|---|---|
| 25.04.2024 02:00 | 52 |
| 25.04.2024 01:45 | 52 |
| 25.04.2024 01:30 | 52 |
| 25.04.2024 01:15 | 52 |
| 25.04.2024 01:00 | 52 |
| 25.04.2024 00:45 | 52 |
| 25.04.2024 00:30 | 52 |
© Bayerisches Landesamt für Umwelt 2024