
- Start >
- Rivers >
- Waterlevel >
- Isar >
- Bad Feilnbach >
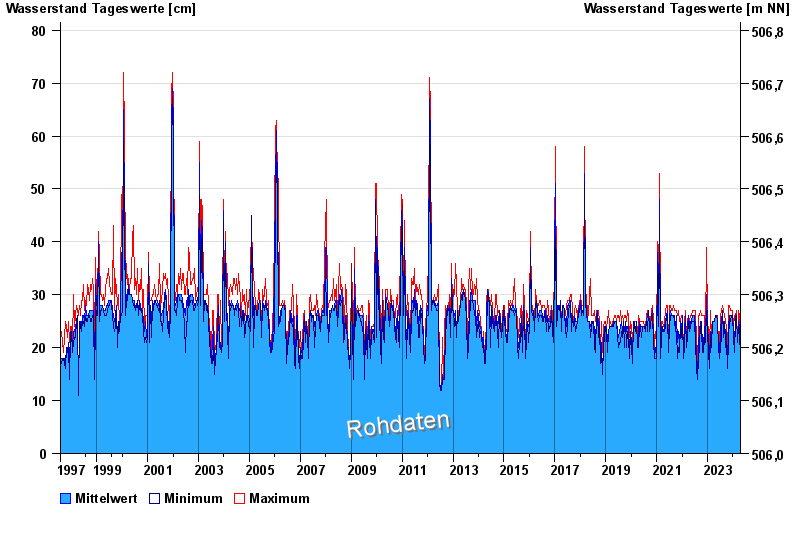
- Chart of total period

Chart of total period Bad Feilnbach / Mühlbach
Waterlevel from 31.07.1997 to 17.04.2024
 Für diesen Pegel sind keine Hochwassermarken hinterlegt.
| Date | Mean value [cm] | Maximum [cm] | Minimum [cm] |
|---|---|---|---|
| 17.04.2024 | 18 | 19 | 17 |
| 16.04.2024 | 18 | 19 | 18 |
| 15.04.2024 | 18 | 19 | 18 |
| 14.04.2024 | 18 | 18 | 17 |
| 13.04.2024 | 18 | 18 | 18 |
| 12.04.2024 | 18 | 19 | 18 |
| 11.04.2024 | 19 | 20 | 18 |
© Bayerisches Landesamt für Umwelt 2024