
- Start >
- Rivers >
- Waterlevel >
- Isar >
- Bad Aibling Willinger Brücke >
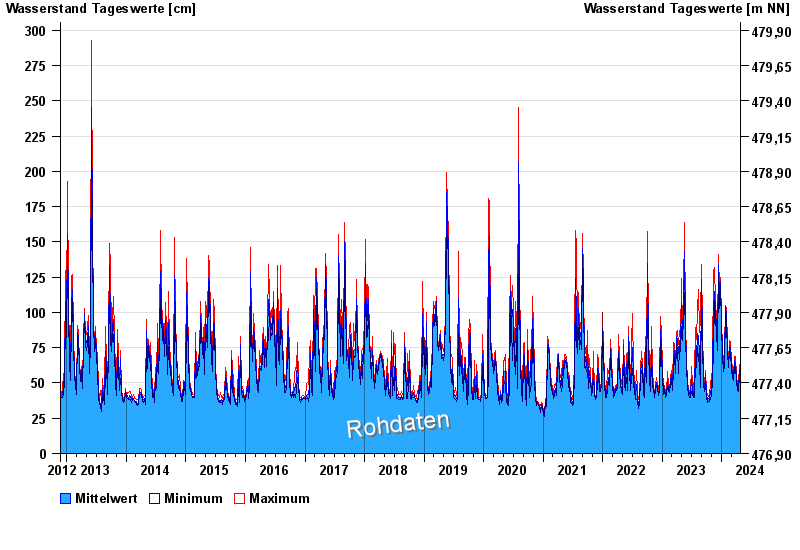
- Chart of total period

Chart of total period Bad Aibling Willinger Brücke / Mangfall
Waterlevel from 23.11.2012 to 24.04.2024
| Date | Mean value [cm] | Maximum [cm] | Minimum [cm] |
|---|---|---|---|
| 24.04.2024 | 56 | 57 | 56 |
| 23.04.2024 | 58 | 60 | 56 |
| 22.04.2024 | 60 | 63 | 57 |
| 21.04.2024 | 59 | 63 | 56 |
| 20.04.2024 | 56 | 62 | 47 |
| 19.04.2024 | 43 | 47 | 40 |
| 18.04.2024 | 39 | 43 | 37 |
© Bayerisches Landesamt für Umwelt 2024