
- Start >
- Rivers >
- Waterlevel >
- Isar >
- Bad Aibling >
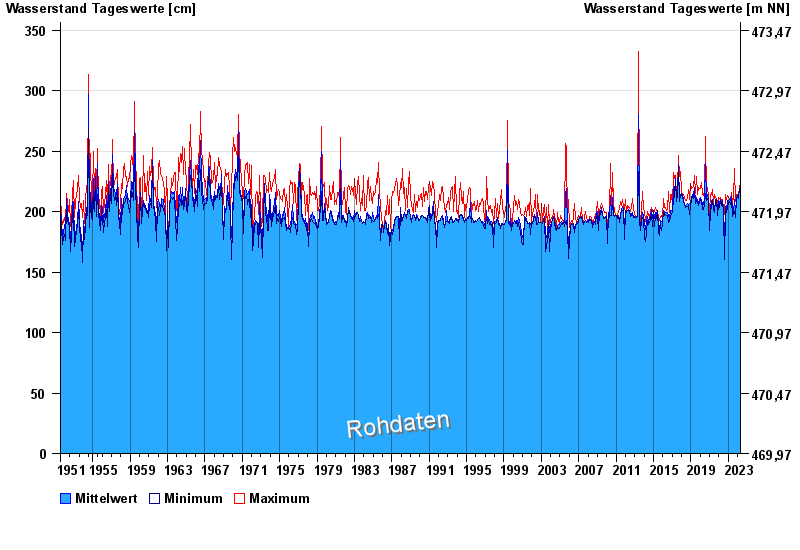
- Chart of total period

Chart of total period Bad Aibling / Triftbach linker Mühlkanal
Waterlevel from 22.07.1951 to 25.04.2024
 Für diesen Pegel sind keine Hochwassermarken hinterlegt.
| Date | Mean value [cm] | Maximum [cm] | Minimum [cm] |
|---|---|---|---|
| 25.04.2024 | 208 | 211 | 200 |
| 24.04.2024 | 210 | 213 | 205 |
| 23.04.2024 | 212 | 214 | 211 |
| 22.04.2024 | 212 | 212 | 212 |
| 21.04.2024 | 212 | 212 | 211 |
| 20.04.2024 | 213 | 216 | 211 |
| 19.04.2024 | 211 | 217 | 205 |
© Bayerisches Landesamt für Umwelt 2024