
- Start >
- Rivers >
- Waterlevel >
- Isar >
- Bad Aibling >
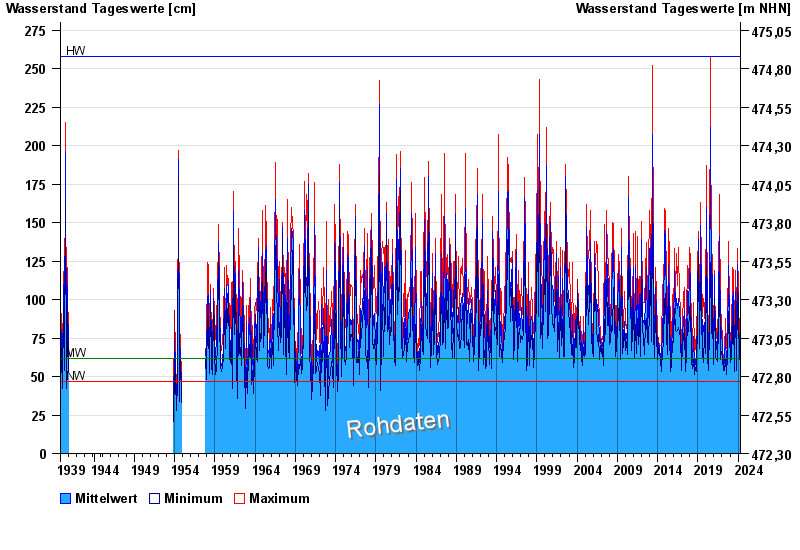
- Chart of total period

Chart of total period Bad Aibling / Glonn
Waterlevel from 30.10.1939 to 19.04.2024
| Date | Mean value [cm] | Maximum [cm] | Minimum [cm] |
|---|---|---|---|
| 19.04.2024 | 56 | 59 | 54 |
| 18.04.2024 | 56 | 58 | 55 |
| 17.04.2024 | 54 | 58 | 52 |
| 16.04.2024 | 54 | 56 | 53 |
| 15.04.2024 | 54 | 57 | 50 |
| 14.04.2024 | 52 | 54 | 50 |
| 13.04.2024 | 52 | 54 | 50 |
© Bayerisches Landesamt für Umwelt 2024