
- Start >
- Rivers >
- Waterlevel >
- Isar >
- Bad Aibling >
- Chart of month

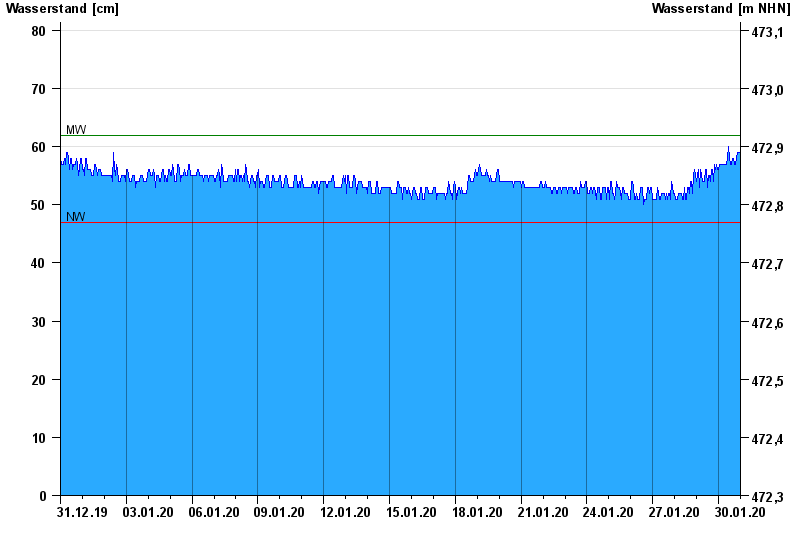
Chart of month Bad Aibling / Glonn
Waterlevel from 31.12.2019 to 30.01.2020
| Date | Waterlevel [cm] |
|---|---|
| 30.01.2020 23:45 | 59 |
| 30.01.2020 23:30 | 59 |
| 30.01.2020 23:15 | 59 |
| 30.01.2020 23:00 | 58 |
| 30.01.2020 22:45 | 58 |
| 30.01.2020 22:30 | 57 |
| 30.01.2020 22:15 | 57 |
© Bayerisches Landesamt für Umwelt 2024