
- Start >
- Rivers >
- Waterlevel >
- Isar >
- Augsburg Oberhausen >
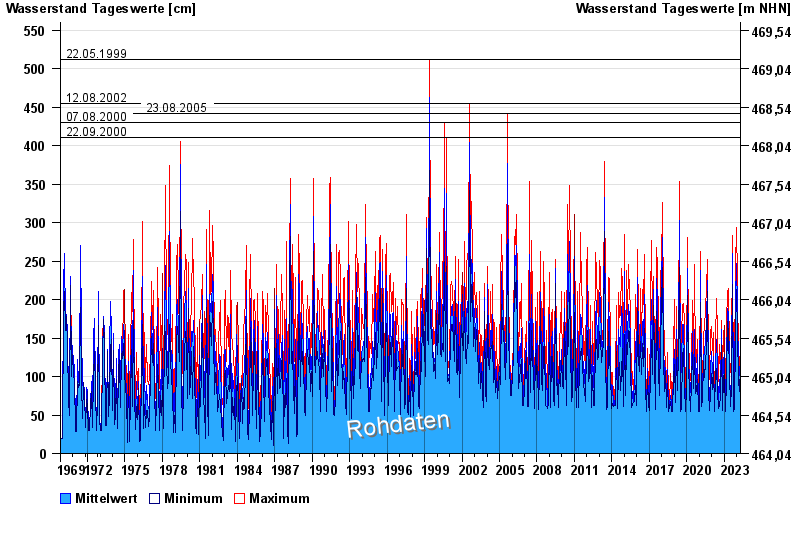
- Chart of total period

Chart of total period Augsburg Oberhausen / Wertach
Waterlevel from 01.11.1969 to 19.04.2024
Hinweis
Ausgabe von Abflusswerten erst bei Hochwasser ab W = 210 cm
- 22.05.1999 Wasserstand: 512 cm
- 12.08.2002 Wasserstand: 455 cm
- 23.08.2005 Wasserstand: 442 cm
- 07.08.2000 Wasserstand: 430 cm
- 22.09.2000 Wasserstand: 410 cm
| Date | Mean value [cm] | Maximum [cm] | Minimum [cm] |
|---|---|---|---|
| 19.04.2024 | 126 | 139 | 113 |
| 18.04.2024 | 117 | 131 | 108 |
| 17.04.2024 | 104 | 110 | 99 |
| 16.04.2024 | 104 | 115 | 101 |
| 15.04.2024 | 98 | 114 | 96 |
| 14.04.2024 | 97 | 99 | 96 |
| 13.04.2024 | 80 | 100 | 52 |
© Bayerisches Landesamt für Umwelt 2024