
- Start >
- Rivers >
- Waterlevel >
- Isar >
- Aschau >
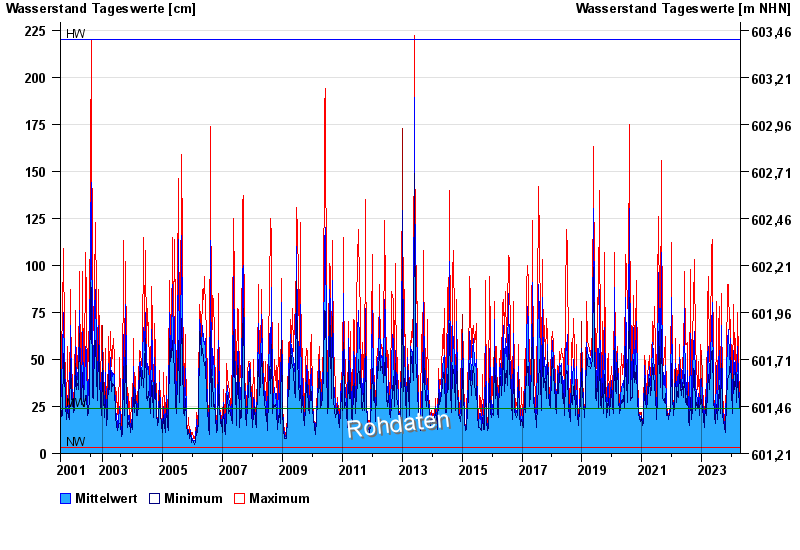
- Chart of total period

Chart of total period Aschau / Prien
Waterlevel from 02.08.2001 to 18.04.2024
| Date | Mean value [cm] | Maximum [cm] | Minimum [cm] |
|---|---|---|---|
| 18.04.2024 | 22 | 23 | 22 |
| 17.04.2024 | 21 | 23 | 20 |
| 16.04.2024 | 20 | 21 | 20 |
| 15.04.2024 | 20 | 22 | 20 |
| 14.04.2024 | 20 | 21 | 20 |
| 13.04.2024 | 21 | 21 | 20 |
| 12.04.2024 | 22 | 23 | 21 |
© Bayerisches Landesamt für Umwelt 2024