
- Start >
- Rivers >
- Waterlevel >
- Isar >
- Aschau >
- Chart of total period

Chart of total period Aschau / Prien
Waterlevel from 02.08.2001 to 25.04.2024
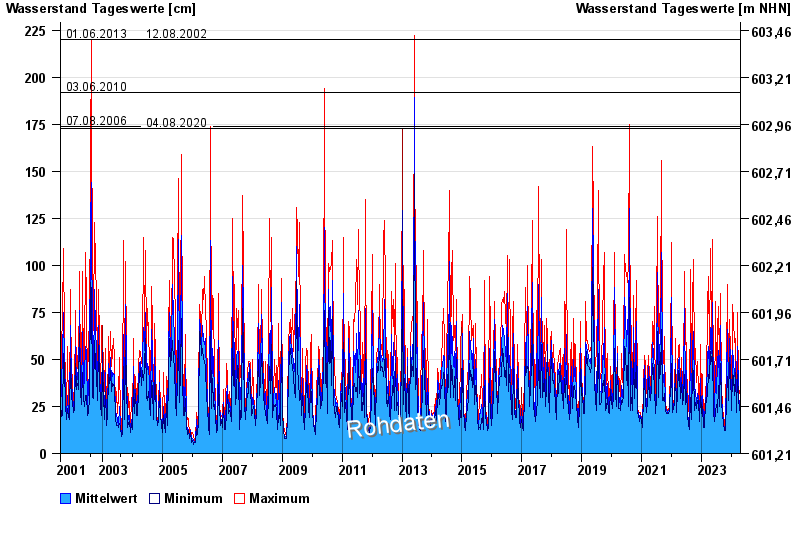
- 01.06.2013 Wasserstand: 220 cm
- 12.08.2002 Wasserstand: 220 cm
- 03.06.2010 Wasserstand: 192 cm
- 07.08.2006 Wasserstand: 174 cm
- 04.08.2020 Wasserstand: 173 cm
| Date | Mean value [cm] | Maximum [cm] | Minimum [cm] |
|---|---|---|---|
| 25.04.2024 | 25 | 26 | 24 |
| 24.04.2024 | 25 | 26 | 24 |
| 23.04.2024 | 27 | 28 | 26 |
| 22.04.2024 | 29 | 32 | 28 |
| 21.04.2024 | 31 | 32 | 29 |
| 20.04.2024 | 31 | 33 | 30 |
| 19.04.2024 | 25 | 32 | 23 |
© Bayerisches Landesamt für Umwelt 2024