
- Start >
- Rivers >
- Waterlevel >
- Inn >
- Waging >
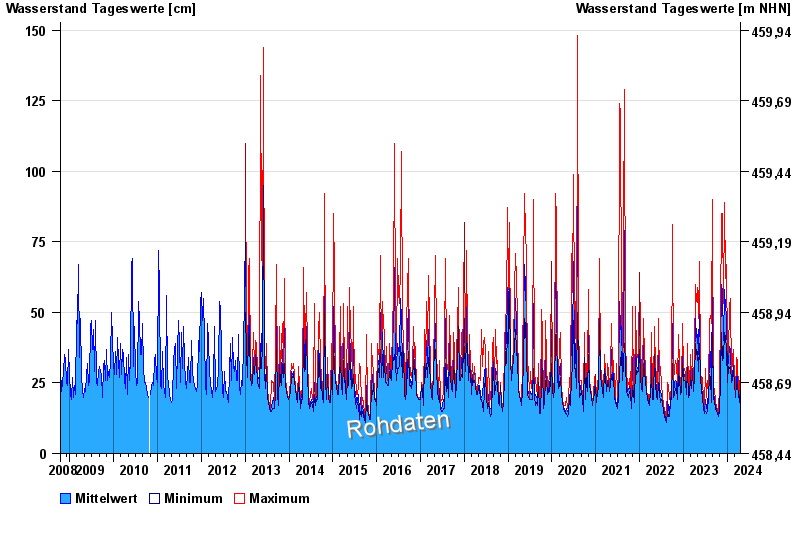
- Chart of total period

Chart of total period Waging / Höllenbach
Waterlevel from 15.10.2008 to 19.04.2024
note
Datenabruf nur 07:00, 15:00 und 23:00 MEZ
| Date | Mean value [cm] | Maximum [cm] | Minimum [cm] |
|---|---|---|---|
| 19.04.2024 | 23 | 30 | 22 |
| 18.04.2024 | 23 | 24 | 22 |
| 17.04.2024 | 20 | 24 | 17 |
| 16.04.2024 | 17 | 18 | 17 |
| 15.04.2024 | 18 | 21 | 17 |
| 14.04.2024 | 17 | 18 | 17 |
| 13.04.2024 | 17 | 18 | 17 |
© Bayerisches Landesamt für Umwelt 2024