
- Start >
- Rivers >
- Waterlevel >
- Inn >
- Unterjettenberg >
- Chart of total period

Chart of total period Unterjettenberg / Saalach
Waterlevel from 01.11.1969 to 18.04.2024
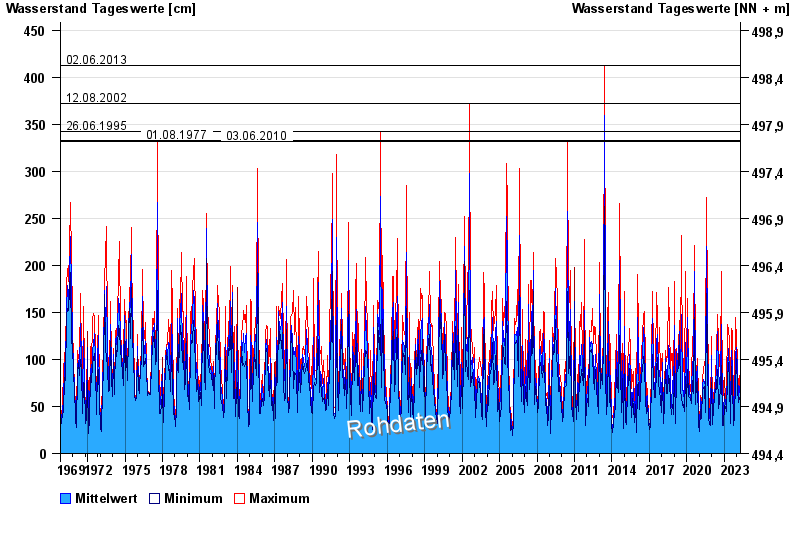
- 02.06.2013 Wasserstand: 413 cm
- 12.08.2002 Wasserstand: 372 cm
- 26.06.1995 Wasserstand: 342 cm
- 01.08.1977 Wasserstand: 333 cm
- 03.06.2010 Wasserstand: 332 cm
| Date | Mean value [cm] | Maximum [cm] | Minimum [cm] |
|---|---|---|---|
| 18.04.2024 | 54 | 56 | 51 |
| 17.04.2024 | 56 | 61 | 53 |
| 16.04.2024 | 70 | 84 | 61 |
| 15.04.2024 | 56 | 62 | 52 |
| 14.04.2024 | 52 | 57 | 48 |
| 13.04.2024 | 49 | 54 | 45 |
| 12.04.2024 | 47 | 50 | 43 |
© Bayerisches Landesamt für Umwelt 2024