
- Start >
- Rivers >
- Waterlevel >
- Inn >
- Teisendorf >
- Chart of total period

Chart of total period Teisendorf / Sur
Waterlevel from 01.11.1969 to 19.04.2024
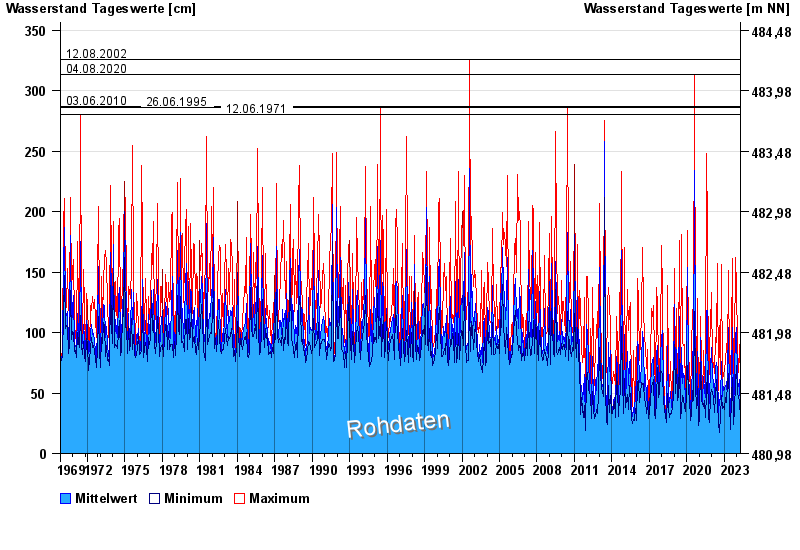
- 12.08.2002 Wasserstand: 326 cm
- 04.08.2020 Wasserstand: 313 cm
- 03.06.2010 Wasserstand: 287 cm
- 26.06.1995 Wasserstand: 286 cm
- 12.06.1971 Wasserstand: 280 cm
| Date | Mean value [cm] | Maximum [cm] | Minimum [cm] |
|---|---|---|---|
| 19.04.2024 | 30 | 35 | 29 |
| 18.04.2024 | 31 | 34 | 29 |
| 17.04.2024 | 29 | 36 | 22 |
| 16.04.2024 | 24 | 25 | 23 |
| 15.04.2024 | 24 | 31 | 21 |
| 14.04.2024 | 22 | 23 | 21 |
| 13.04.2024 | 23 | 24 | 22 |
© Bayerisches Landesamt für Umwelt 2024