
- Start >
- Rivers >
- Waterlevel >
- Inn >
- Simbach >
- Chart of year

Chart of year Simbach / Simbach
Waterlevel from 11.08.2020 to 10.08.2021
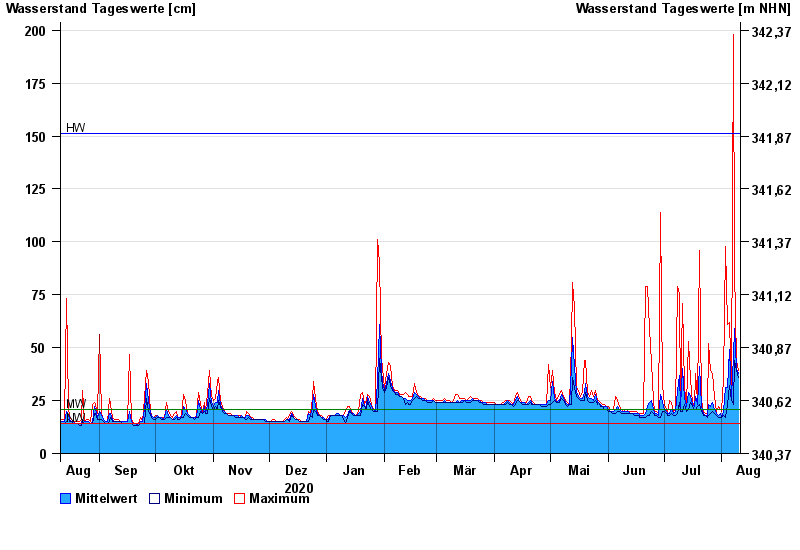
| Date | Mean value [cm] | Maximum [cm] | Minimum [cm] |
|---|---|---|---|
| 10.08.2021 | 38 | 39 | 36 |
| 09.08.2021 | 40 | 44 | 39 |
| 08.08.2021 | 59 | 87 | 44 |
| 07.08.2021 | 46 | 198 | 23 |
| 06.08.2021 | 27 | 32 | 25 |
| 05.08.2021 | 49 | 62 | 32 |
| 04.08.2021 | 31 | 61 | 23 |
© Bayerisches Landesamt für Umwelt 2024