
- Start >
- Rivers >
- Waterlevel >
- Inn >
- Mühltal >
- Chart of total period

Chart of total period Mühltal / Glonn
Waterlevel from 01.11.1969 to 25.04.2024
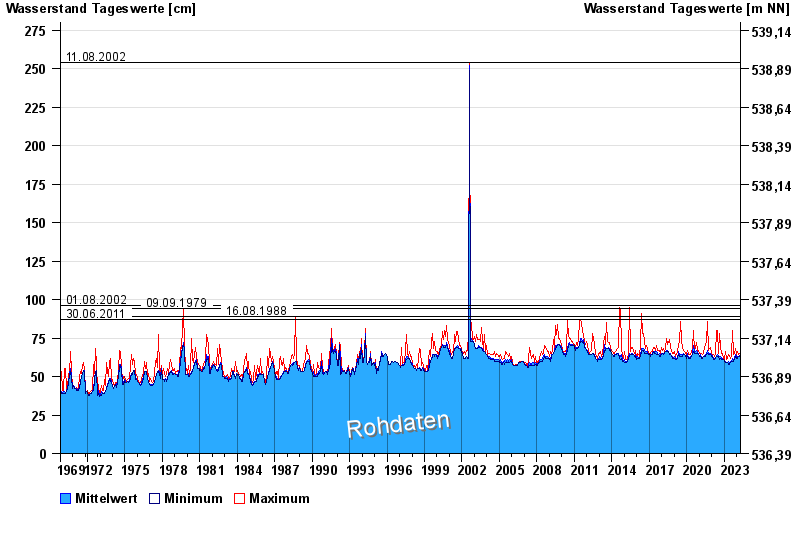
- 11.08.2002 Wasserstand: 254 cm
- 01.08.2002 Wasserstand: 96 cm
- 09.09.1979 Wasserstand: 94 cm
- 16.08.1988 Wasserstand: 89 cm
- 30.06.2011 Wasserstand: 87 cm
| Date | Mean value [cm] | Maximum [cm] | Minimum [cm] |
|---|---|---|---|
| 25.04.2024 | 63 | 64 | 63 |
| 24.04.2024 | 64 | 64 | 63 |
| 23.04.2024 | 64 | 64 | 63 |
| 22.04.2024 | 63 | 64 | 63 |
| 21.04.2024 | 63 | 64 | 63 |
| 20.04.2024 | 63 | 64 | 63 |
| 19.04.2024 | 63 | 64 | 63 |
© Bayerisches Landesamt für Umwelt 2024