
- Start >
- Rivers >
- Waterlevel >
- Inn >
- Mühldorf >
- Chart of year

Chart of year Mühldorf / Inn
Waterlevel from 10.07.2020 to 09.07.2021
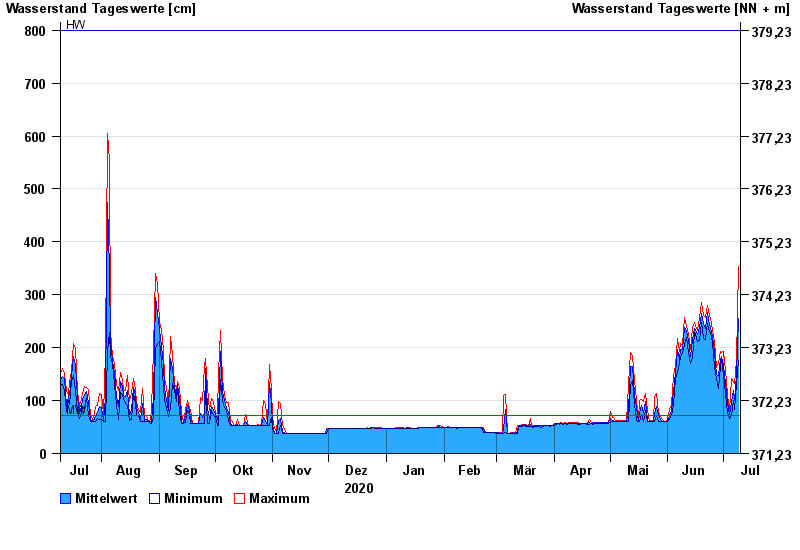
| Date | Mean value [cm] | Maximum [cm] | Minimum [cm] |
|---|---|---|---|
| 09.07.2021 | 256 | 354 | 176 |
| 08.07.2021 | 149 | 176 | 133 |
| 07.07.2021 | 100 | 133 | 83 |
| 06.07.2021 | 119 | 135 | 100 |
| 05.07.2021 | 99 | 141 | 72 |
| 04.07.2021 | 72 | 80 | 67 |
| 03.07.2021 | 95 | 112 | 78 |
© Bayerisches Landesamt für Umwelt 2024