
- Start >
- Rivers >
- Waterlevel >
- Inn >
- Mühldorf >
- Chart of year

Chart of year Mühldorf / Inn
Waterlevel from 29.10.2020 to 28.10.2021
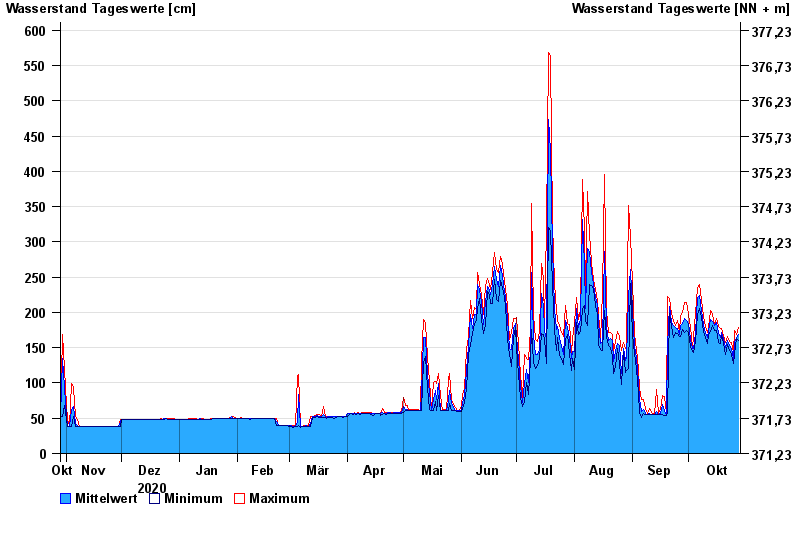
| Date | Mean value [cm] | Maximum [cm] | Minimum [cm] |
|---|---|---|---|
| 28.10.2021 | 168 | 179 | 160 |
| 27.10.2021 | 165 | 169 | 163 |
| 26.10.2021 | 157 | 174 | 140 |
| 25.10.2021 | 135 | 143 | 128 |
| 24.10.2021 | 149 | 157 | 140 |
| 23.10.2021 | 153 | 159 | 146 |
| 22.10.2021 | 160 | 166 | 154 |
© Bayerisches Landesamt für Umwelt 2024