
- Start >
- Rivers >
- Waterlevel >
- Inn >
- Linden >
- Chart of year

Chart of year Linden / Rott
Waterlevel from 01.07.2020 to 30.06.2021
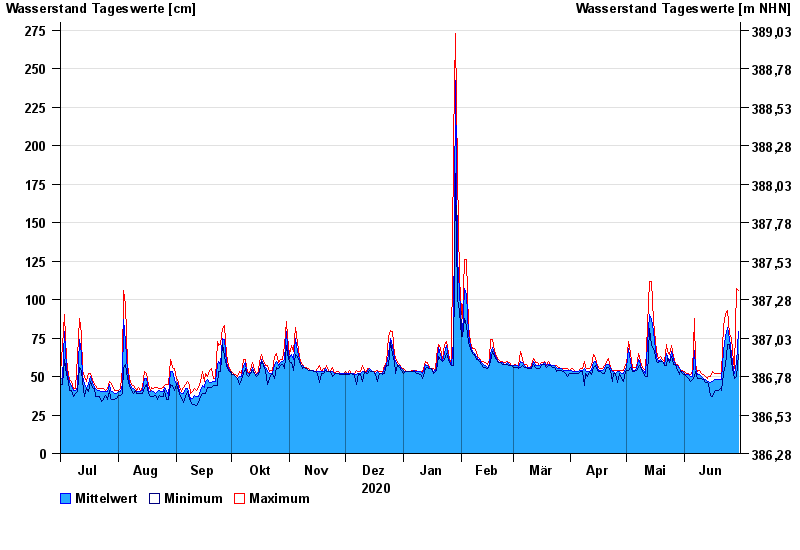
| Date | Mean value [cm] | Maximum [cm] | Minimum [cm] |
|---|---|---|---|
| 30.06.2021 | 79 | 106 | 64 |
| 29.06.2021 | 59 | 107 | 50 |
| 28.06.2021 | 52 | 55 | 49 |
| 27.06.2021 | 54 | 59 | 52 |
| 26.06.2021 | 65 | 75 | 59 |
| 25.06.2021 | 75 | 78 | 71 |
| 24.06.2021 | 82 | 93 | 71 |
© Bayerisches Landesamt für Umwelt 2024