
- Start >
- Rivers >
- Waterlevel >
- Inn >
- Eschelbach >
- Chart of total period

Chart of total period Eschelbach / Inn
Waterlevel from 01.11.1969 to 23.04.2024
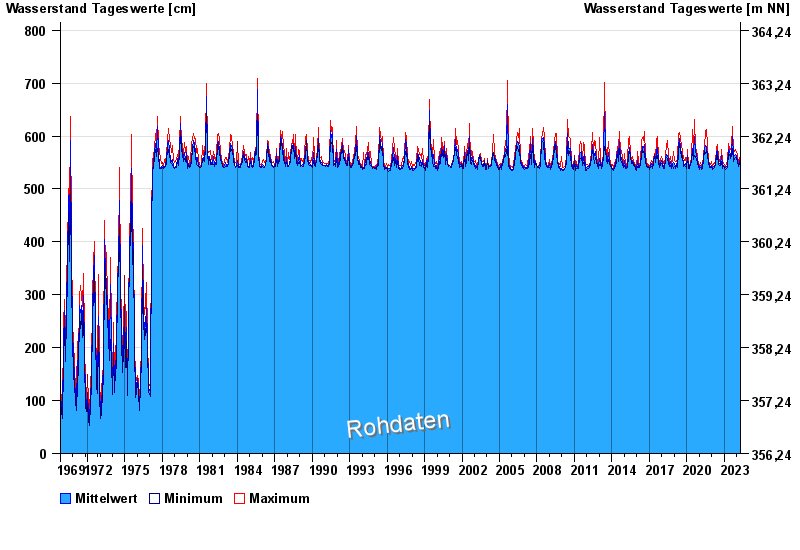
| Date | Mean value [cm] | Maximum [cm] | Minimum [cm] |
|---|---|---|---|
| 23.04.2024 | 545 | 548 | 542 |
| 22.04.2024 | 544 | 548 | 541 |
| 21.04.2024 | 543 | 547 | 541 |
| 20.04.2024 | 546 | 548 | 543 |
| 19.04.2024 | 546 | 550 | 543 |
| 18.04.2024 | 551 | 554 | 549 |
| 17.04.2024 | 556 | 560 | 550 |
© Bayerisches Landesamt für Umwelt 2024